Summary
- Sustainable funds close July at $303.9 billion, up $18.1 billion due to shift in funds and market appreciation, with net flows adding an estimated $917 million, or 0.32%.
- Sustainable funds register average gain of 2.14%, ranging from 17.17% to -3.87%.
- Market movement and repurposed funds contribute $17.2 billion in net assets.
- Pioneer Investments moves into ranks of top 20 firms as a result of repurposing two funds.
- Top 10 funds: Universe is dominated by funds that exclude alcohol and/or tobacco.
- New funds: Impact Shares NAACP Minority Empowerment ETF.
[ihc-hide-content ihc_mb_type=”show” ihc_mb_who=”reg” ihc_mb_template=”4″ ]
Sustainable Funds Close July at $303.9 Billion, Up $18.1 Billion, Due to Shift in Funds and Market Appreciation with Net Flows Adding an Estimated $917 million, or 0.32%
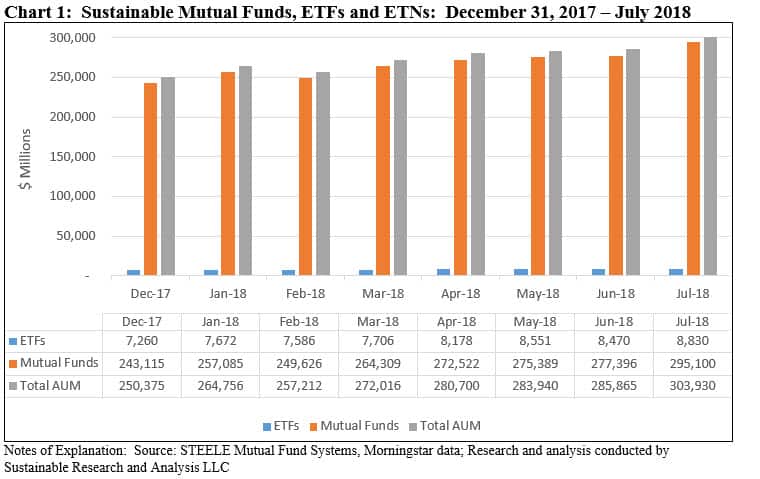
The net assets of 1,046 sustainable funds, including mutual funds, exchange-traded funds (ETFs) and exchange-traded notes (ETNs), ended the month of July with $303.9 billion in assets versus $285.9 billion at the end of June. The increase in net assets for the month, in the amount of $18.1 billion, was sourced, in descending order, to repurposed funds, market movement as well as net cash inflows. The net assets of sustainable funds reached a new all-time high that, since the beginning of the year, increased by $53.6 billion, of which an estimated 75% is attributable to repurposed mutual funds, or existing funds that have adopted a sustainable strategy or investment approach by formally amending their prospectus. Refer to Chart 1.

Mutual fund assets stood at $295.1 billion as of July 29, 2018 while ETFs and ETNs closed the month at $8.8 billion. The relative proportion of the two segments remain unchanged at about 97% and 3%, respectively. Assets sourced to institutional only mutual funds versus all other funds recorded an uptick to $100.5 billion, or 34% of the segment’s assets, versus $93.0 billion at the end of June.
Explicitly designated sustainable funds are offered by a universe of 116 fund groups that were in in operation at the end of July. This reflects a net increase of one fund group representing the addition of Pioneer Funds as well as Impact Shares while at the same time OFI Funds has been consolidated into the Oppenheimer Funds group. The increase in the number of funds month-over-month, from 1,025 to 1,046, is largely attributable to the addition of three repurposed funds comprised of 12 share classes, one new ETF and the addition of new share classes associated with existing funds.
Sustainable Funds Register Average Gain of 2.14%, Ranging from 17.17% to -3.87%
Within a universe of 1,043 sustainable funds with performance for the full month and their corresponding share classes, returns for the month of July averaged 2.14%. This was the best average one-month total return performance results turned in by the universe of sustainable funds since January of this year. A total of 970 funds, or 93%, posted 0.00 to positive results for the month, that ranged from a high of 17.17% to a low of -3.87%.
The S&P 500 recorded its best gain since January, up 3.72%, as strong corporate earnings combined with the anticipation of robust economic growth in the second quarter lifted share prices and pushed aside, for now, domestic political and geopolitical uncertainties, global trade war tensions as well as some potential domestic economic headwinds. Concurrently, the SUSTAIN Equity Fund Index gained 3.93%, leading the S&P 500 for the third month in a row. Also in July, the SUSTAIN Bond Fund Indicator recorded an increase of 0.06% and in the process beat the Bloomberg Barclays U.S. Aggregate Bond Index while also expanding its year-to-date outperformance by 21 basis points.
The SUSTAIN Large Cap Equity Fund Index tracks the total return performance of the ten largest actively managed large-cap U.S. equity oriented mutual funds that employ a sustainable investing strategy beyond absolute reliance on exclusionary practices while the SUSTAIN Bond Fund Indicator tracks the total return performance of the five largest actively managed investment-grade intermediate bond funds. For further details, refer to For further details, refer to SUSTAIN Large Cap Equity Fund Index Up 3.93% in July 2018, Leading S&P 500 by 21 bps.https://sustainablest.wpengine.com/sustain-large-cap-equity-fund-index-up-3-93-in-july-2018-leading-sp-500-by-21-bps/
Market Movement and Repurposed Funds Contribute $17.2 Billion in Net Assets
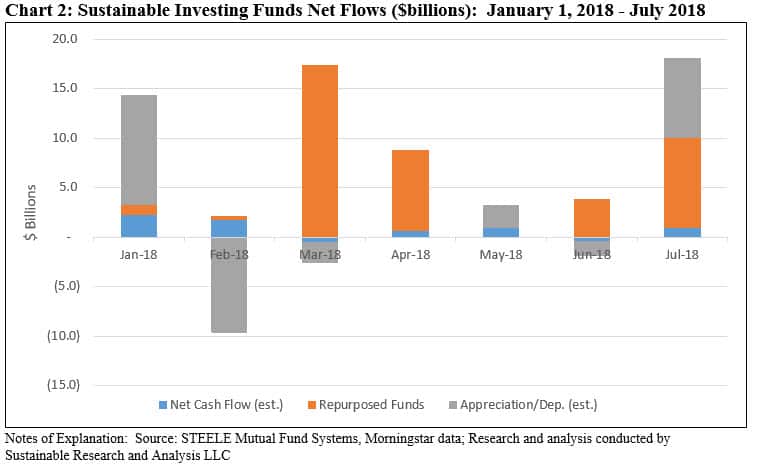
Market movement contributed an estimated $8.1 billion while repurposed funds shifted another $9.1 billion, for a combined addition of $17.2 billion in July. This represents a 2.96% increase due to these factors in July versus an estimated gain of only 0.3% for mutual funds and ETFs combined over the same interval. Net cash inflows contributed an estimated $917 million, or about 0.32% relative to June. The net assets of sustainable funds reached a new all-time high that, since the beginning of the year, increased by $53.6 billion, of which about 75% is attributable to repurposed mutual funds, or existing funds that have adopted a sustainable strategy or investment approach by formally amending their prospectus. Refer to Chart 2.

Pioneer Investments Moves into the Ranks of Top 20 Firms as a Result of Repurposing Two Funds
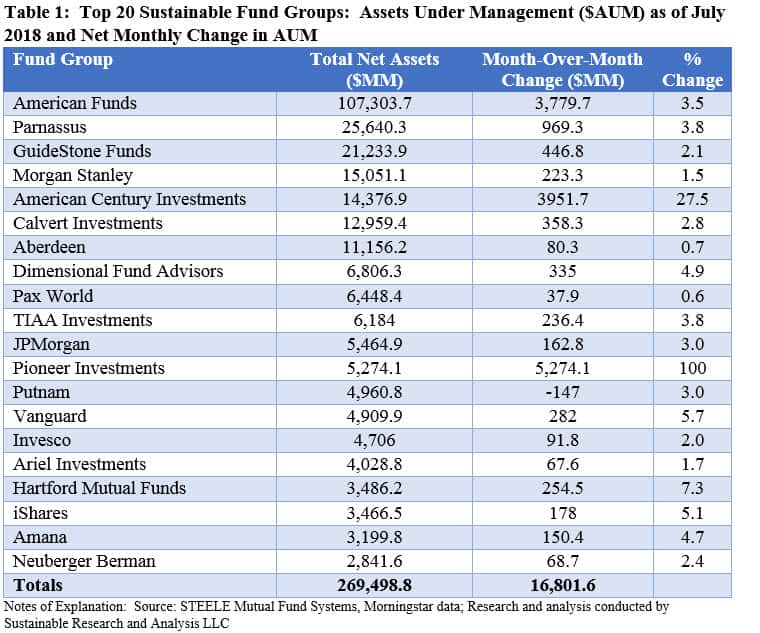
A total of 116 fund groups offered sustainable investment products at the end of July, versus 115 fund groups at the end of June, but the top 20 fund groups accounted for $269.5 billion of the segment’s assets under management, representing 89% of the total. By adopting the exclusionary provision to avoid investments in tobacco stocks, American Century’s NT High Income Fund, with $3.8 billion in assets, pushed American Century higher among the ranks of the top 20 sustainable fund groups. It now ranks 5th after displacing Calvert Funds and Aberdeen. Refer to Table 1.
Also by repurposing 2 funds with a combined total of $5.3 billion in assets, Pioneer Funds
moved into the ranks of the top 20. It now ranks 12th and, in the process, displaced the $2.8 billion Eventide Funds Group that now ranks 21st.
About a year after closing on the acquisition of Pioneer Investments by Amundi Asset Management, the combined Amundi Pioneer Asset Management entity in the US amended the selection of investments for the almost $5.0 billion Pioneer Fund and the $271.5 million Pioneer Classic Fund. The prospectus for each of the two funds was amended to include the consideration of sustainable business practices, including through environmental, social and/or corporate governance (ESG) policies, practices or outcomes. Each amended prospectus also empowers the investment adviser to exclude corporate issuers that do not meet or exceed minimum ESG standards and to exclude companies significantly involved in certain business activities, including but not limited to, the production of alcohol, tobacco products and certain controversial military weapons, and the operation of coal mines and gambling casinos and other gaming businesses.
The top 20 fund groups accounted for $16.8 billion of the month-over-month change in total net assets, representing 89% of the total, with an average of $855 million increase per fund group in the top 20. In addition to Pioneer, the largest gainers were the American Funds, American Century Investments and Parnassus. None of the fund groups that make up the top 20 saw a month-over-month decline in assets. The fund groups that experienced the smallest increase in assets included Pax World ($37.9 million), Ariel ($67.6) and Invesco ($81.8).

Largest Monthly Gains Recorded by Fund Groups and Funds
The following fund firms and funds contributed to the largest gains attributable to market movement, positive flows or repurposed funds, or some combination these factors:
- The largest monthly gain, in the amount of $5.3 billion is attributable to the Pioneer Funds, described above.
- The second largest monthly gain in the amount of almost $4.0 billion was realized by American Century Investments. This pick-up is almost entirely attributable to the adoption of exclusionary language by two funds applicable to companies deriving a majority of their revenues from tobacco products. The two existing funds include American Century NT Diversified Bond ($3,005.1 billion) and American Century NT High Income Fund ($798.9 million. The addition of these two funds elevates American Century’s sustainable assets to $14.4 billion and secures its 5th place ranking now ahead of both Calvert and Aberdeen.
- The third largest monthly gain in July was realized by American Funds’ $107.3 billion Washington Mutual Fund, a fund offered by American Funds that excludes companies deriving a majority of their revenues from alcohol or tobacco products. The fund group’s Washington Mutual Fund is the only fund in the group that is explicitly described as a sustainable fund. It continues to account for 35.3% of the sustainable segment’s assets under management.
- Parnassus Funds, which ranks second after American Funds, added $969.3 million in net assets. While two funds within the group, including Parnassus Fixed Income and Parnassus Institutional, experiences slight net declines, the other funds across the complex saw growth in net assets. Two funds in particular experienced strong net gains, accounting for about 54% of the gain. These included Parnassus Core Equity Fund with a gain of $399.5 million and Parnassus Endeavor Investor Shares that gained $127.6 million.
Largest Monthly Declines Recorded by Fund Groups and Funds
None of the fund groups falling within the ranks of the top 20 experienced net declines in net assets in the month of July.
Top 10 Funds: Universe is Dominated by Funds that Exclude Alcohol and/or Tobacco
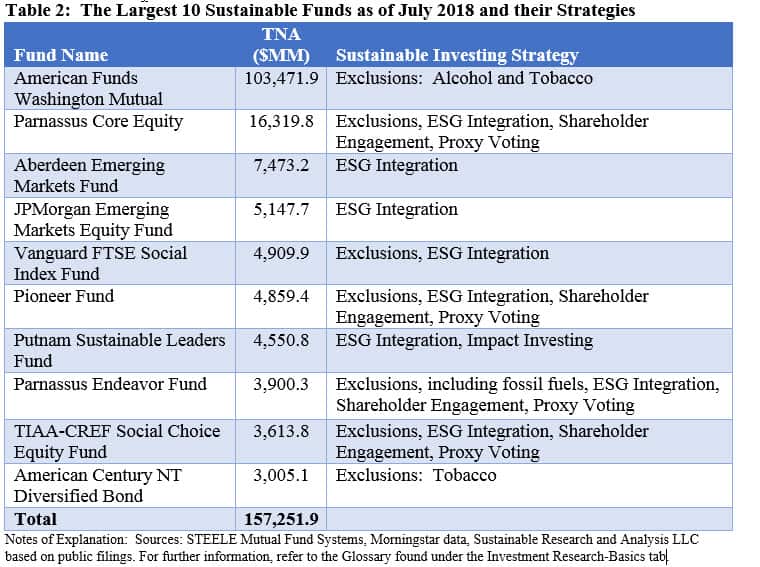
The top 10 sustainable funds, by size, account for $157.3 billion in assets under management, or almost 52% of the segment’s total. The list reflects the introduction of two large sized funds added this month, namely the Pioneer Fund and American Century NT Diversified Bond. Parnassus is the only fund group that is represented by two funds in the top 10. This universe of ten funds is dominated by two sustainable funds that qualify on the limited basis of their practices of excluding alcohol and/or tobacco stocks. Refer to Table 2.

New Funds: Impact Shares NAACP Minority Empowerment ETF
Impact Shares launched a new ETF, the Impact Shares NAACP Minority Empowerment ETF, a $2.1 million fund that seeks to replicate the performance of the Morningstar Minority Empowerment Index, designed to track large and mid-capitalization companies that have strong minority empowerment practices. The underlying index is constructed using company level indicators, scores, and indicator relevance weighting from Sustainalytics that include certain social criteria identified and compiled by the National Association for the Advancement of Colored People (NAACP) to measure the strength of minority empowerment practices and products or services for each company. Based on that scoring, excluding those companies with a detrimental score for applicable controversies (as determined by Sustainalytics), the 200 best scoring companies (after applying an optimized weighting methodology) are selected as the final underlying index components.


