Performance of equities and bonds reversed positions in September as large cap equities posted a total return gain of 1.87% while investment-grade intermediate bonds ended the month lower at -0.53%
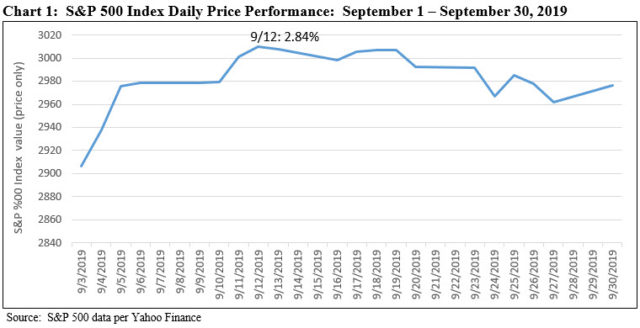
The performance of equities and bonds reversed positions in September as large cap equities, tracked by the S&P 500 Index, posted a total return gain of 1.87% while investment-grade intermediate bonds ended the month lower at -0.53% on the back of higher yields. The stock market advanced as high as 2.84% at the close on September 12th just about a week or so after the US and China set a date for the resumption of trade negotiations in early October. But the sense of optimism engendered by the resumption of trade talks was in part eclipsed in the second half of the month by worries over weaker US economic reports and, in turn, the potential impact on corporate earnings, the surprise introduction of liquidity risk in the overnight funding market as well as domestic political and geopolitical uncertainties. In turn, the stock market paused and turned lower, registering five daily price declines that shaved 1.03% off the S&P 500’s mid-month gain. Refer to Chart 1. Still, the US stock market ended on an up note but bonds didn’t do as well, dropping lower. Longer dated Treasury bonds suffered through a -2.56% decline. Small cap stocks weren’t far behind large caps, with the Russell 2000 posting a gain of 1.77% while value stocks across the capitalization continuum outperformed growth stocks, in some cases by wide margins. Foreign stocks did even better, with the MSCI EAFE (Net) Index recording a gain of 2.9% while the MSCI ACWI, ex USA gained 2.6% buoyed by the performance of Japan and India.
Domestic economic developments
On the domestic economic front, the Federal Reserve on October 18th at the conclusion of its September Federal Open Market Committee (FOMC) meeting, reduced, for the second time this year, the short-term federal funds rate by 25 basis points to a top rate of 2%. According to Jerome H. Powell, the Fed chair, the United States economy remained strong and unemployment low, but that “there are risks to this positive outlook.” Such potential risks were reinforced later in the month when the Department of Commerce reported that personal-consumption expenditures or household spending which has been responsible for sustaining economic growth, inched up a seasonally adjusted 0.1% in August from July. The modest growth marked a sharp pullback from the first seven months of the year when the average was 0.5% per month. In a separate report, orders for long-lasting equipment and machinery, a proxy for business investment, fell 0.2% last month from July and 1.7% from August 2018. Unrelated, liquidity shortages emerged in the overnight repo market that forced the Federal Reserve Bank to intercede by injecting liquidity into the lending market. It was reported that by October 7th the Fed had injected more than $330 billion to stabilize the market that had experienced a rate spike of nearly 10% at one point versus about 2% in the days prior. While some attributed the repo market volatility to an imbalance in bank reserves, the precise cause was undetermined and could exacerbate global liquidity issues. For now, the repo market appears to have been stabilized.
Domestic political developments
On the domestic political front, House Democrats announced the commencement of an impeachment inquiry after it came to light that President Trump and top administration officials had allegedly pressured leaders of multiple foreign nations, most notably Ukraine, in ways presumably intended to advance Trump’s personal and political interests.
Geopolitical events
On the geopolitical sphere, Britain’s Brexit strategy remains unresolved and it continues to sow Parliamentary instability, riots in Hong Kong are continuing to gain momentum without an end in sight, Iran was accused of sponsoring an attack on Saudi Arabia that reportedly crippled more than half of Saudi Arabia’s oil-exporting capability, and North Korean nuclear ambitions remain unchecked.
Sustainable (SUSTAIN) Large Cap Equity Fund Index recorded a gain of 1.44%, 43 basis points (bps) below the S&P 500
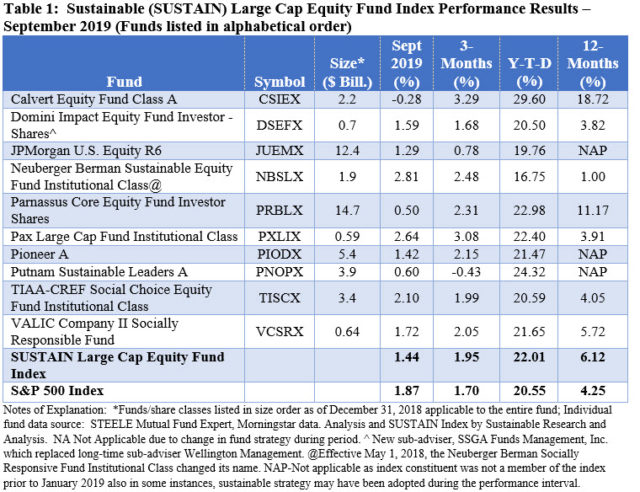
Against this backdrop, the Sustainable (SUSTAIN) Large Cap Equity Fund Index recorded a gain of 1.44%, 43 basis points (bps) below the S&P 500, as seven of ten constituents lagged behind the conventional index. The SUSTAIN Index was otherwise leading the S&P 500 during the quarter as was the case for six of the previous nine months although not in succession. Constituent returns ranged from a high of 2.81% delivered by the Neuberger Berman Sustainable Equity Fund Institutional shares to a low of -0.28% posted by the Calvert Equity Fund A shares. Neuberger was one of three funds that posted returns in excess of 2% in September, the other two being Pax Lage Cap Fund Institutional and TIAA-CREF Social Choice Fund Institutional. A large cap blend fund, Neuberger Berman Sustainable Equity benefited from its 15.06% exposure to non-US stocks, primarily developed European markets, the second largest non-US stock position among the ten index constituents, as foreign stocks outperformed domestic stocks in September. Pax Large Cap Institutional was the second best index performer, up 2.64%. In its recently published semi-annual report, the fund reflects on the interplay between financial analysis and ESG integration when it described the addition of eight new stocks to the portfolio in the first half of 2019, using our fundamental ESG integrated approach of seeking companies that we believe exhibit strong and improving financial metrics, and that also demonstrate leadership from an ESG perspective. Examples of these ESG leaders are Procter & Gamble and Equinix. Positions that exceeded our price targets include McCormick and Eli Lilly, which were sold to make room for, in our view, better ideas in the portfolio.”
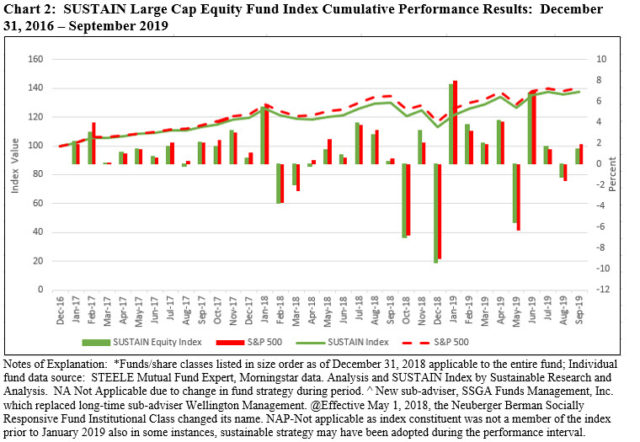
Notwithstanding its -0.28% total return in September, the first negative monthly return in 2019, Calvert Equity Fund A has contributed to the strong relative performance achieved by the SUSTAIN Large Cap Equity Fund Index over the previous quarter, year-to-date and 12-months. During these intervals the SUSTAIN Index beat the S&P 500 by 11.5%, 1.46% and 1.87%, respectively. Over the nine month period and trailing 12-month intervals in particular, Calvert Equity Fund A has been the faraway leader with returns of 29.60% and 18.72%, respectively. Refer to Table 1 and Chart 2.
The Sustainable (SUSTAIN) Bond Fund Index also lagged behind its counterpart conventional benchmark, the Bloomberg Barclays US Aggregate Index.
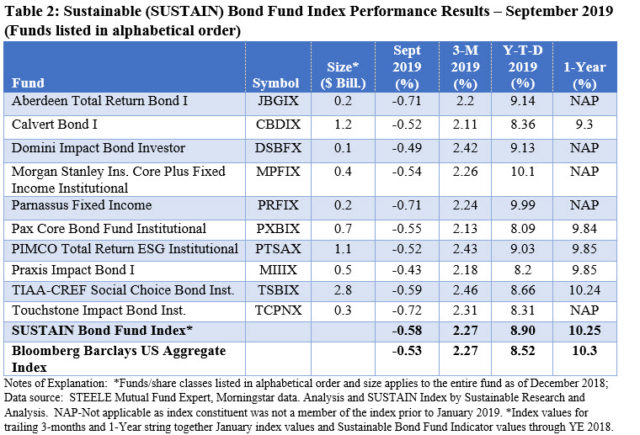
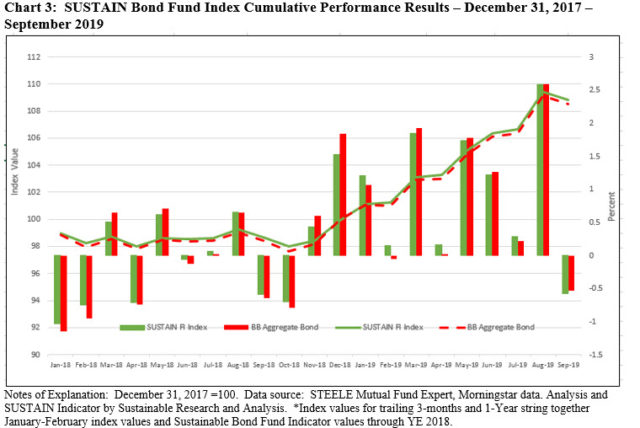
The Sustainable (SUSTAIN) Bond Fund Index also lagged behind its counterpart conventional benchmark, the Bloomberg Barclays US Aggregate Index, posting a decline of -0.58% in September versus -0.53% recorded by the Bloomberg benchmark, or a 5 bps differential. This is the second month in a row and the fourth time this year that the SUSTAIN Bond Fund Index lagged behind. Still, the SUSTAIN Index matched the performance of the Bloomberg Index for the quarter, it leads on a year-to-date basis and lags over the preceding 12-months by just 5 bps.
Each of the ten funds that comprise the SUSTAIN Index recorded negative results in September during an interval of rising rates across the yield curve above 1-year maturities. Still, four funds of 10 outperformed in September, posting results in excess of -0.53%. The best performing fund was the high credit quality Praxis Impact Bond Fund I that declined -0.43% and generated a positive but lagging 2.18% gain in the third quarter. The fund employs a combination of a faith-based strategy along with negative screening (exclusions) and ESG integration approach to investing. Also weighing in with stronger relative returns in September were the Domini Impact Bond Investor shares, Calvert Bond I and PIMCO Total Return ESG Institutional with excess returns of 0.4%, 0.1% and 0.1%, respectively. Trailing for the month were Touchstone Impact Bond Institutional, Aberdeen Total Return Bond and Parnassus Fixed Income, posting total returns of -0.72%, -0.71% and -0.71%, in that order. Refer to Table 2 and Chart 3.
The Sustainable (SUSTAIN) Foreign Equity Fund Index beats index in September, adding 2.71% versus the MSCI ACWI, ex US which was up 2.57%
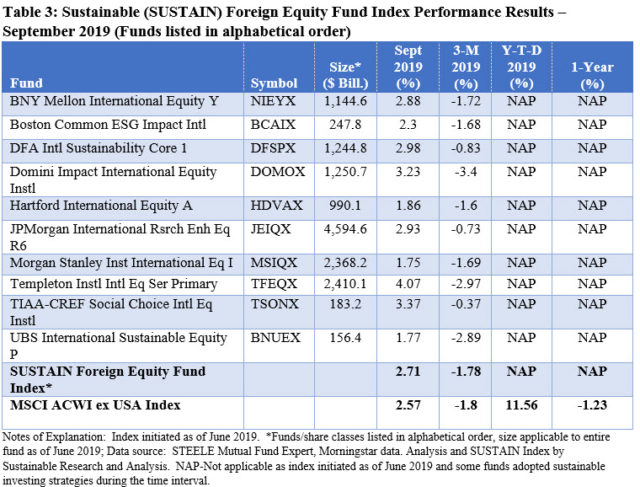
The Sustainable (SUSTAIN) Foreign Equity Fund Index is the only SUSTAIN index this month to exceed the performance of it conventional counterpart, adding 2.71% versus the MSCI ACWI, ex USA Index which was up 2.57%. The index was lifted by the performance of six of the ten index members, each of which posted results in excess of 2.57%, ranging from 2.88% to a high of 4.07%. The lead was recorded by ESG integrator Templeton Institutional International Equity Fund Primary shares. The fund, which was overweight in Health Care (11.7%) and Communications Services (5.5%) and underweight in Financial Services (17.2%) and Consumer Cyclicals (5.9%), benefited from its value oriented focus and significant overweighting in European developed markets which delivered a slightly better monthly results relative to the fund’s benchmark. TIAA-CREF Social Choice International Equity Institutional and Domini Impact International Equity Institutional both also beat the benchmark by 80 bps and 16 bps, respectively.
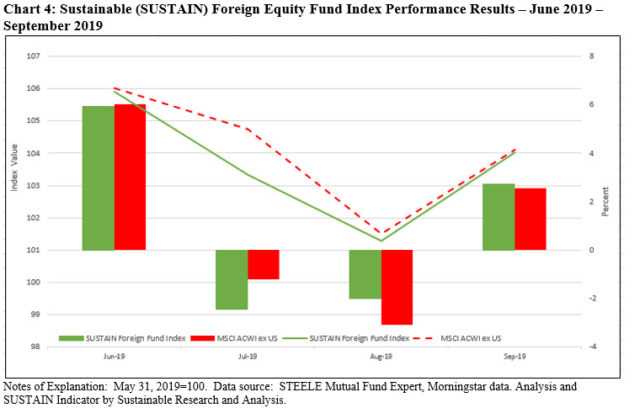
The SUSTAIN Foreign Equity Fund Index, which was initiated as of June 2019, leads the conventional benchmark by 2 bps in the third quarter. Refer to Table 3 and Chart 4.
Performance of ESG indices in September versus non-ESG Indices: Both domestic and broader-based foreign ESG indices led conventional counterparts while conventional bond and emerging market equity indices outperform
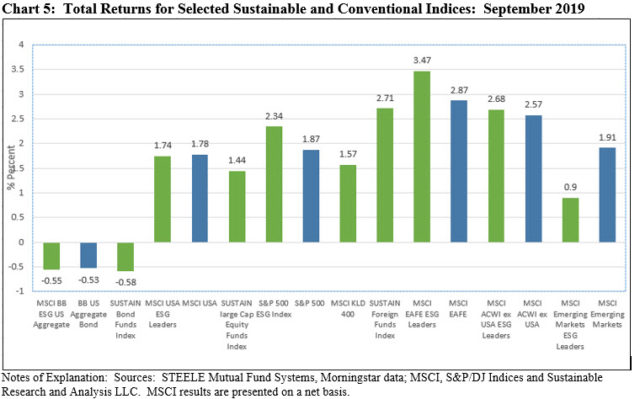
Fixed Income-The Bloomberg Barclays US Aggregate Index beat both the MSCI Bloomberg Barclays ESG US Aggregate Index and Sustainable (SUSTAIN) Bond Fund Index by 2 bps and 5 bps, respectively. Refer to Chart 5.
US Equities-The S&P 500 ESG Index was the clear winner in September, up 2.01%. By range of 47 bps to 90 bps, the S&P 500 ESG index eclipsed the MSCI USA ESG Leaders Index, MSCI KLD 400 Index, MSCI USA Index and Sustainable (SUSTAIN) Large Cap Equity Fund Index and the S&P 500 Index. Refer to Chart 5.
Foreign Broad-Based Equities-The MSCI EAFE ESG Leaders Index was another clear winner in September, up 3.47%. It outperformed the MSCI ACWI ex USA ESG Leaders, up 2.68%, MSCI EAFE (Net) Index, up 2.87%, and the Sustainable (SUSTAIN) Foreign Fund Index, up 2.71%. Refer to Chart 5.
Emerging Markets-The MSCI Emerging Markets Index was up 1.91%, for a 1.01% differential relative to the MSCI Emerging Markets ESG Leaders counterpart. Refer to Chart 5.
Two of Three SUSTAIN Fund Indices Lagged: September 2019 Update
Performance of equities and bonds reversed positions in September as large cap equities posted a total return gain of 1.87% while investment-grade intermediate bonds ended the month lower at -0.53% The performance of equities and bonds reversed positions in September as large cap equities, tracked by the S&P 500 Index, posted a total return gain…
Share This Article:
Performance of equities and bonds reversed positions in September as large cap equities posted a total return gain of 1.87% while investment-grade intermediate bonds ended the month lower at -0.53%
The performance of equities and bonds reversed positions in September as large cap equities, tracked by the S&P 500 Index, posted a total return gain of 1.87% while investment-grade intermediate bonds ended the month lower at -0.53% on the back of higher yields. The stock market advanced as high as 2.84% at the close on September 12th just about a week or so after the US and China set a date for the resumption of trade negotiations in early October. But the sense of optimism engendered by the resumption of trade talks was in part eclipsed in the second half of the month by worries over weaker US economic reports and, in turn, the potential impact on corporate earnings, the surprise introduction of liquidity risk in the overnight funding market as well as domestic political and geopolitical uncertainties. In turn, the stock market paused and turned lower, registering five daily price declines that shaved 1.03% off the S&P 500’s mid-month gain. Refer to Chart 1. Still, the US stock market ended on an up note but bonds didn’t do as well, dropping lower. Longer dated Treasury bonds suffered through a -2.56% decline. Small cap stocks weren’t far behind large caps, with the Russell 2000 posting a gain of 1.77% while value stocks across the capitalization continuum outperformed growth stocks, in some cases by wide margins. Foreign stocks did even better, with the MSCI EAFE (Net) Index recording a gain of 2.9% while the MSCI ACWI, ex USA gained 2.6% buoyed by the performance of Japan and India.
Domestic economic developments
On the domestic economic front, the Federal Reserve on October 18th at the conclusion of its September Federal Open Market Committee (FOMC) meeting, reduced, for the second time this year, the short-term federal funds rate by 25 basis points to a top rate of 2%. According to Jerome H. Powell, the Fed chair, the United States economy remained strong and unemployment low, but that “there are risks to this positive outlook.” Such potential risks were reinforced later in the month when the Department of Commerce reported that personal-consumption expenditures or household spending which has been responsible for sustaining economic growth, inched up a seasonally adjusted 0.1% in August from July. The modest growth marked a sharp pullback from the first seven months of the year when the average was 0.5% per month. In a separate report, orders for long-lasting equipment and machinery, a proxy for business investment, fell 0.2% last month from July and 1.7% from August 2018. Unrelated, liquidity shortages emerged in the overnight repo market that forced the Federal Reserve Bank to intercede by injecting liquidity into the lending market. It was reported that by October 7th the Fed had injected more than $330 billion to stabilize the market that had experienced a rate spike of nearly 10% at one point versus about 2% in the days prior. While some attributed the repo market volatility to an imbalance in bank reserves, the precise cause was undetermined and could exacerbate global liquidity issues. For now, the repo market appears to have been stabilized.
Domestic political developments
On the domestic political front, House Democrats announced the commencement of an impeachment inquiry after it came to light that President Trump and top administration officials had allegedly pressured leaders of multiple foreign nations, most notably Ukraine, in ways presumably intended to advance Trump’s personal and political interests.
Geopolitical events
On the geopolitical sphere, Britain’s Brexit strategy remains unresolved and it continues to sow Parliamentary instability, riots in Hong Kong are continuing to gain momentum without an end in sight, Iran was accused of sponsoring an attack on Saudi Arabia that reportedly crippled more than half of Saudi Arabia’s oil-exporting capability, and North Korean nuclear ambitions remain unchecked.
Sustainable (SUSTAIN) Large Cap Equity Fund Index recorded a gain of 1.44%, 43 basis points (bps) below the S&P 500
Against this backdrop, the Sustainable (SUSTAIN) Large Cap Equity Fund Index recorded a gain of 1.44%, 43 basis points (bps) below the S&P 500, as seven of ten constituents lagged behind the conventional index. The SUSTAIN Index was otherwise leading the S&P 500 during the quarter as was the case for six of the previous nine months although not in succession. Constituent returns ranged from a high of 2.81% delivered by the Neuberger Berman Sustainable Equity Fund Institutional shares to a low of -0.28% posted by the Calvert Equity Fund A shares. Neuberger was one of three funds that posted returns in excess of 2% in September, the other two being Pax Lage Cap Fund Institutional and TIAA-CREF Social Choice Fund Institutional. A large cap blend fund, Neuberger Berman Sustainable Equity benefited from its 15.06% exposure to non-US stocks, primarily developed European markets, the second largest non-US stock position among the ten index constituents, as foreign stocks outperformed domestic stocks in September. Pax Large Cap Institutional was the second best index performer, up 2.64%. In its recently published semi-annual report, the fund reflects on the interplay between financial analysis and ESG integration when it described the addition of eight new stocks to the portfolio in the first half of 2019, using our fundamental ESG integrated approach of seeking companies that we believe exhibit strong and improving financial metrics, and that also demonstrate leadership from an ESG perspective. Examples of these ESG leaders are Procter & Gamble and Equinix. Positions that exceeded our price targets include McCormick and Eli Lilly, which were sold to make room for, in our view, better ideas in the portfolio.”
Notwithstanding its -0.28% total return in September, the first negative monthly return in 2019, Calvert Equity Fund A has contributed to the strong relative performance achieved by the SUSTAIN Large Cap Equity Fund Index over the previous quarter, year-to-date and 12-months. During these intervals the SUSTAIN Index beat the S&P 500 by 11.5%, 1.46% and 1.87%, respectively. Over the nine month period and trailing 12-month intervals in particular, Calvert Equity Fund A has been the faraway leader with returns of 29.60% and 18.72%, respectively. Refer to Table 1 and Chart 2.
The Sustainable (SUSTAIN) Bond Fund Index also lagged behind its counterpart conventional benchmark, the Bloomberg Barclays US Aggregate Index.
The Sustainable (SUSTAIN) Bond Fund Index also lagged behind its counterpart conventional benchmark, the Bloomberg Barclays US Aggregate Index, posting a decline of -0.58% in September versus -0.53% recorded by the Bloomberg benchmark, or a 5 bps differential. This is the second month in a row and the fourth time this year that the SUSTAIN Bond Fund Index lagged behind. Still, the SUSTAIN Index matched the performance of the Bloomberg Index for the quarter, it leads on a year-to-date basis and lags over the preceding 12-months by just 5 bps.
Each of the ten funds that comprise the SUSTAIN Index recorded negative results in September during an interval of rising rates across the yield curve above 1-year maturities. Still, four funds of 10 outperformed in September, posting results in excess of -0.53%. The best performing fund was the high credit quality Praxis Impact Bond Fund I that declined -0.43% and generated a positive but lagging 2.18% gain in the third quarter. The fund employs a combination of a faith-based strategy along with negative screening (exclusions) and ESG integration approach to investing. Also weighing in with stronger relative returns in September were the Domini Impact Bond Investor shares, Calvert Bond I and PIMCO Total Return ESG Institutional with excess returns of 0.4%, 0.1% and 0.1%, respectively. Trailing for the month were Touchstone Impact Bond Institutional, Aberdeen Total Return Bond and Parnassus Fixed Income, posting total returns of -0.72%, -0.71% and -0.71%, in that order. Refer to Table 2 and Chart 3.
The Sustainable (SUSTAIN) Foreign Equity Fund Index beats index in September, adding 2.71% versus the MSCI ACWI, ex US which was up 2.57%
The Sustainable (SUSTAIN) Foreign Equity Fund Index is the only SUSTAIN index this month to exceed the performance of it conventional counterpart, adding 2.71% versus the MSCI ACWI, ex USA Index which was up 2.57%. The index was lifted by the performance of six of the ten index members, each of which posted results in excess of 2.57%, ranging from 2.88% to a high of 4.07%. The lead was recorded by ESG integrator Templeton Institutional International Equity Fund Primary shares. The fund, which was overweight in Health Care (11.7%) and Communications Services (5.5%) and underweight in Financial Services (17.2%) and Consumer Cyclicals (5.9%), benefited from its value oriented focus and significant overweighting in European developed markets which delivered a slightly better monthly results relative to the fund’s benchmark. TIAA-CREF Social Choice International Equity Institutional and Domini Impact International Equity Institutional both also beat the benchmark by 80 bps and 16 bps, respectively.
The SUSTAIN Foreign Equity Fund Index, which was initiated as of June 2019, leads the conventional benchmark by 2 bps in the third quarter. Refer to Table 3 and Chart 4.
Performance of ESG indices in September versus non-ESG Indices: Both domestic and broader-based foreign ESG indices led conventional counterparts while conventional bond and emerging market equity indices outperform

Fixed Income-The Bloomberg Barclays US Aggregate Index beat both the MSCI Bloomberg Barclays ESG US Aggregate Index and Sustainable (SUSTAIN) Bond Fund Index by 2 bps and 5 bps, respectively. Refer to Chart 5.
US Equities-The S&P 500 ESG Index was the clear winner in September, up 2.01%. By range of 47 bps to 90 bps, the S&P 500 ESG index eclipsed the MSCI USA ESG Leaders Index, MSCI KLD 400 Index, MSCI USA Index and Sustainable (SUSTAIN) Large Cap Equity Fund Index and the S&P 500 Index. Refer to Chart 5.
Foreign Broad-Based Equities-The MSCI EAFE ESG Leaders Index was another clear winner in September, up 3.47%. It outperformed the MSCI ACWI ex USA ESG Leaders, up 2.68%, MSCI EAFE (Net) Index, up 2.87%, and the Sustainable (SUSTAIN) Foreign Fund Index, up 2.71%. Refer to Chart 5.
Emerging Markets-The MSCI Emerging Markets Index was up 1.91%, for a 1.01% differential relative to the MSCI Emerging Markets ESG Leaders counterpart. Refer to Chart 5.
Sustainableinvest.com
Benefits
Free access to regularly updated original research and analysis focused exclusively on sustainable finance and investing, providing investors with the guidance needed to make informed investment decisions that align with their personal values and financial goals while also contributing to the advancement of positive long-term environmental and social outcomes.
By offering financial support for our current work, either in the form of a one-time or regular contributions, you help to defray some of the costs associated with conducting our research and analysis as well as to maintain the www.sustainablest.wpengine.com website.
Helping us to expand our research capabilities and offerings over time to cover additional relevant topics geared to sustainable investors.
Sign up to free newsletters.
By submitting this form, you are consenting to receive marketing emails from: . You can revoke your consent to receive emails at any time by using the SafeUnsubscribe® link, found at the bottom of every email. Emails are serviced by Constant Contact