Summary
The 3.07% gain of the S&P 500 Index in November, driven by strong corporate earnings, solid economic growth around the world and signs of progress in the US on the Republican led tax bill, also powered the performance of sustainable mutual funds, exchange-traded funds (ETFs) and exchange-traded notes (ETNs) along with the 3 sustainable model portfolios tracked by Sustainable Research and Analysis LLC. During the month, sustainable funds added $11.7 billion in assets, but the gains were largely due to market appreciation and strategy changes implemented by existing funds.
The S&P 500 Index Gained 3.07% in November While Bonds Declined Slightly
The S&P 500 Index gained 3.07% during the month of November, recording its second best monthly total return of the year after February’s 3.97% gain. The index is up an impressive 20.49% year-to-date, powered by the performance of all but two sectors, including telecommunications services and energy. If sustained through the rest of the year to December 31, the year 2017 will end with the best results since the S&P 500 registered a gain of 23.45% in 2009 following the financial crisis. The Dow Jones Industrial Average (DJIA), which closed above the 24000 level for the first time on the last day in November, delivered an even stronger gain by adding 4.39% and 21.85% year-to-date. The Nasdaq Composite Index trailed both the S&P 500 and DJIA, increasing 2.34%. The results for November, which reversed losses sustained during the first two weeks of the month, were driven by strong corporate earnings, solid economic growth around the world and signs of progress in the US on the Republican led tax bill—factors that overcame lingering concerns about the sustainability of the market and tensions between the US and North Korea. At the same time, US corporate bonds, as measured by the Bloomberg Barclays U.S. Aggregate Bond Index, registered a decline of -0.13% as interest rates rose during the month. 10-year Treasury bond yields climbed from 2.38% at the end of October to end the month of November at 2.42%, or an increase of 3.4 basis points (bps). Upbeat assessments regarding the country’s economic expansion reinforced expectations that the Federal Reserve will raise interest rates in mid-December and continue on its path of gradual rate increases in 2018 unless wage growth and inflation heat up.
The positive outlook for economic expansion was not limited to the US. The Organization for Economic Cooperation and Development (OECD) reported late in the month that the global economy is on course for the best year since 2010 as both the US and the Eurozone grow more rapidly than had been expected. The OECD added that further acceleration is likely in 2018 but that growth would slow from 2019 without new measures to encourage business investment which remains short of pre-crisis levels. The OECD raised its growth forecasts for the US and the Eurozone this year and next. It now sees the US growing at 2.2% this year and Eurozone at 2.4%. For 2018, OECD expects US growth at 2.5% and the Eurozone at 2.1%.
Outside the US, the MSCI EAFE Index gained 1.05% while Latin America, as measure by the S&P Latin America 40 Index, gave up -3.62% on the back of economic growth in Latin America that sped up in the third quarter as the long awaited recovery takes hold.
Sustainable Portfolios Again Posted Positive Results But Underperformed Their Benchmarks
The three sustainable indexes tracking aggressive, moderate and conservative risk profiles, with their varying stock and bond allocations, outperformed the corresponding fund model portfolios for the second month in a row, in a range from 3 bps to 22 bps. This was attributable to the fact that the Vanguard FTSE Social Index Fund-Investor Shares, up 2.84% for the month, lagged behind the S&P 500 Index by a slight 23 bps. While this was the second month in a row during which the fund underperformed its non-ESG benchmark, the Vanguard FTSE Social Index-Investor Shares remains ahead of the index on a year-to-date basis with its return of 22.82%. By a very thin margin of 3 bps, TIAA-CREF Social Choice Bond Retail, down -0.1% for the month, exceeded the performance of the Bloomberg-Barclays U.S. Aggregate Bond Index. Since the first of the year, this fund, up 3.83%, is also staying ahead its non-ESG benchmark which has recorded a gain of 3.07%. Refer to Table 1.
Table 1: Performance Summary Table: Total Returns to November 30, 2017

The Aggressive Sustainable Portfolio (95% stocks/5% bonds) posted a gain of 2.76%, followed by more modest gains of 2.06% and 0.83% recorded by the Moderate Sustainable Portfolio (60% stocks/40% bonds) and the Conservative Sustainable Portfolio (20% stocks/80% bonds). As noted above, each of the sustainable portfolios lagged their designated indexes.
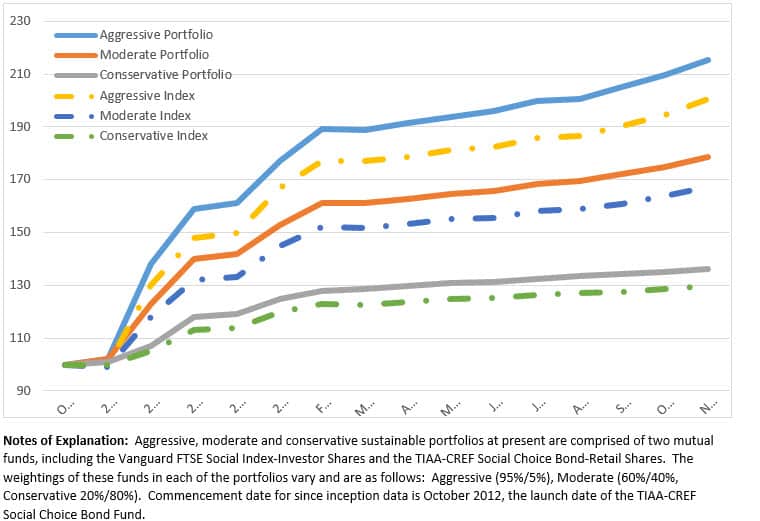
On a cumulative basis since October 2012, the three sustainable portfolios, Aggressive, Moderate and Conservative, are up 115.27%, 78.44% and 36.34%, respectively. The results continue to exceed the total return performance results recorded by their corresponding indexes that are up 100.37%, 67.33% and 29.56%. At the same time, the relative month-over-month performance advantage enjoyed by the three portfolios remains unchanged. Refer to Chart 1.
Chart 1: Performance Summary Chart: Total Returns 2012 – November 30, 2017

Performance Across Sustainable Funds Varied As Much As 12.21%
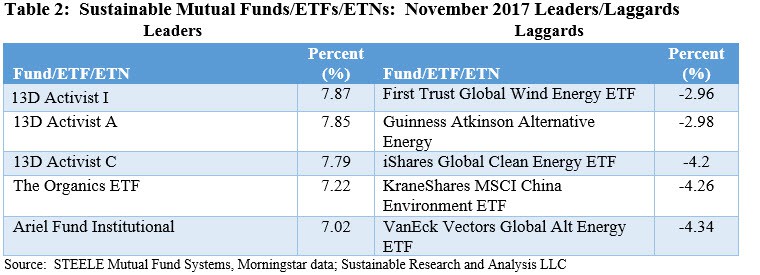
For the universe of 762 sustainable funds, including mutual funds, exchange-traded funds and exchange-traded notes along with their corresponding share classes, returns for the month of November averaged 1.64%, just about in line with October’s 1.62% average. Returns ranged from a high of 7.87% recorded by 13D Activist Fund Class I shares, a fund managed by 13D Management LLC that invests primarily in common stocks of US companies of any market capitalization that are the target of shareholder activism but are further qualified on the basis of environmental, social and governance factors, with a strong emphasis on corporate governance. At the other end of the range, a return of -4.34% was recorded by the Van Eck Vectors Global Alternative Energy ETF. Other alternative energy investors also sustained losses, likely linked to reports that the Republican led tax bill includes several provisions that scale back incentives for wind and solar power. Refer to Table 2.

Sustainable Funds Add $11.7 Billion in Assets, Again Largely Due to Market Appreciation and Strategy Changes Affecting 3 Existing Funds
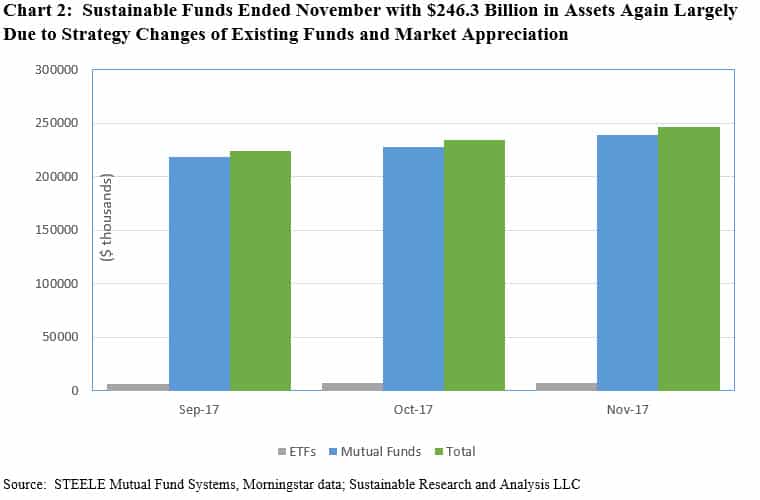
Sustainable funds, including mutual funds, ETFs and ETNs, ended the month of November with $246.3 billion in net assets, up $11.7 billion or 4.75% higher. Sustainable mutual funds accounted for $11.3 billion or almost 97% of the November gain.
Sustainable mutual funds ended the month with $239.1 billion in assets, up $11.3 billion, or 5% higher, while ETFs and ETNs closed November with almost $7.2 billion, up just .05% from $6.8 billion the previous month.
While registering a net gain for the month, mutual funds likely added only about $1.6 billion in new money. About $5.5 billion, or 49% of the increase, is attributable to strategy changes implemented by 3 JPMorgan mutual funds/16 share classes that adopted ESG policies as of November 1, 2016. Further, based on the average performance of sustainable funds during the month of November, roughly $4.2 billion can be attributed to market appreciation.
ETFs and ETNs closed the month of November at $7.2 billion in assets, a mere $353.8 million, or 0.05%, higher than the $6.8 billion at the end of October. An estimated $231.3 million in net inflows may be attributed to ETNs and ETFs during the month. Refer to Chart 2.

Sustainable Portfolios Performance Summary: November 2017
Summary
Share This Article:
Summary
The 3.07% gain of the S&P 500 Index in November, driven by strong corporate earnings, solid economic growth around the world and signs of progress in the US on the Republican led tax bill, also powered the performance of sustainable mutual funds, exchange-traded funds (ETFs) and exchange-traded notes (ETNs) along with the 3 sustainable model portfolios tracked by Sustainable Research and Analysis LLC. During the month, sustainable funds added $11.7 billion in assets, but the gains were largely due to market appreciation and strategy changes implemented by existing funds.
The S&P 500 Index Gained 3.07% in November While Bonds Declined Slightly
The S&P 500 Index gained 3.07% during the month of November, recording its second best monthly total return of the year after February’s 3.97% gain. The index is up an impressive 20.49% year-to-date, powered by the performance of all but two sectors, including telecommunications services and energy. If sustained through the rest of the year to December 31, the year 2017 will end with the best results since the S&P 500 registered a gain of 23.45% in 2009 following the financial crisis. The Dow Jones Industrial Average (DJIA), which closed above the 24000 level for the first time on the last day in November, delivered an even stronger gain by adding 4.39% and 21.85% year-to-date. The Nasdaq Composite Index trailed both the S&P 500 and DJIA, increasing 2.34%. The results for November, which reversed losses sustained during the first two weeks of the month, were driven by strong corporate earnings, solid economic growth around the world and signs of progress in the US on the Republican led tax bill—factors that overcame lingering concerns about the sustainability of the market and tensions between the US and North Korea. At the same time, US corporate bonds, as measured by the Bloomberg Barclays U.S. Aggregate Bond Index, registered a decline of -0.13% as interest rates rose during the month. 10-year Treasury bond yields climbed from 2.38% at the end of October to end the month of November at 2.42%, or an increase of 3.4 basis points (bps). Upbeat assessments regarding the country’s economic expansion reinforced expectations that the Federal Reserve will raise interest rates in mid-December and continue on its path of gradual rate increases in 2018 unless wage growth and inflation heat up.
The positive outlook for economic expansion was not limited to the US. The Organization for Economic Cooperation and Development (OECD) reported late in the month that the global economy is on course for the best year since 2010 as both the US and the Eurozone grow more rapidly than had been expected. The OECD added that further acceleration is likely in 2018 but that growth would slow from 2019 without new measures to encourage business investment which remains short of pre-crisis levels. The OECD raised its growth forecasts for the US and the Eurozone this year and next. It now sees the US growing at 2.2% this year and Eurozone at 2.4%. For 2018, OECD expects US growth at 2.5% and the Eurozone at 2.1%.
Outside the US, the MSCI EAFE Index gained 1.05% while Latin America, as measure by the S&P Latin America 40 Index, gave up -3.62% on the back of economic growth in Latin America that sped up in the third quarter as the long awaited recovery takes hold.
Sustainable Portfolios Again Posted Positive Results But Underperformed Their Benchmarks
The three sustainable indexes tracking aggressive, moderate and conservative risk profiles, with their varying stock and bond allocations, outperformed the corresponding fund model portfolios for the second month in a row, in a range from 3 bps to 22 bps. This was attributable to the fact that the Vanguard FTSE Social Index Fund-Investor Shares, up 2.84% for the month, lagged behind the S&P 500 Index by a slight 23 bps. While this was the second month in a row during which the fund underperformed its non-ESG benchmark, the Vanguard FTSE Social Index-Investor Shares remains ahead of the index on a year-to-date basis with its return of 22.82%. By a very thin margin of 3 bps, TIAA-CREF Social Choice Bond Retail, down -0.1% for the month, exceeded the performance of the Bloomberg-Barclays U.S. Aggregate Bond Index. Since the first of the year, this fund, up 3.83%, is also staying ahead its non-ESG benchmark which has recorded a gain of 3.07%. Refer to Table 1.
Table 1: Performance Summary Table: Total Returns to November 30, 2017
The Aggressive Sustainable Portfolio (95% stocks/5% bonds) posted a gain of 2.76%, followed by more modest gains of 2.06% and 0.83% recorded by the Moderate Sustainable Portfolio (60% stocks/40% bonds) and the Conservative Sustainable Portfolio (20% stocks/80% bonds). As noted above, each of the sustainable portfolios lagged their designated indexes.
On a cumulative basis since October 2012, the three sustainable portfolios, Aggressive, Moderate and Conservative, are up 115.27%, 78.44% and 36.34%, respectively. The results continue to exceed the total return performance results recorded by their corresponding indexes that are up 100.37%, 67.33% and 29.56%. At the same time, the relative month-over-month performance advantage enjoyed by the three portfolios remains unchanged. Refer to Chart 1.
Chart 1: Performance Summary Chart: Total Returns 2012 – November 30, 2017
Performance Across Sustainable Funds Varied As Much As 12.21%
For the universe of 762 sustainable funds, including mutual funds, exchange-traded funds and exchange-traded notes along with their corresponding share classes, returns for the month of November averaged 1.64%, just about in line with October’s 1.62% average. Returns ranged from a high of 7.87% recorded by 13D Activist Fund Class I shares, a fund managed by 13D Management LLC that invests primarily in common stocks of US companies of any market capitalization that are the target of shareholder activism but are further qualified on the basis of environmental, social and governance factors, with a strong emphasis on corporate governance. At the other end of the range, a return of -4.34% was recorded by the Van Eck Vectors Global Alternative Energy ETF. Other alternative energy investors also sustained losses, likely linked to reports that the Republican led tax bill includes several provisions that scale back incentives for wind and solar power. Refer to Table 2.
Sustainable Funds Add $11.7 Billion in Assets, Again Largely Due to Market Appreciation and Strategy Changes Affecting 3 Existing Funds
Sustainable funds, including mutual funds, ETFs and ETNs, ended the month of November with $246.3 billion in net assets, up $11.7 billion or 4.75% higher. Sustainable mutual funds accounted for $11.3 billion or almost 97% of the November gain.
Sustainable mutual funds ended the month with $239.1 billion in assets, up $11.3 billion, or 5% higher, while ETFs and ETNs closed November with almost $7.2 billion, up just .05% from $6.8 billion the previous month.
While registering a net gain for the month, mutual funds likely added only about $1.6 billion in new money. About $5.5 billion, or 49% of the increase, is attributable to strategy changes implemented by 3 JPMorgan mutual funds/16 share classes that adopted ESG policies as of November 1, 2016. Further, based on the average performance of sustainable funds during the month of November, roughly $4.2 billion can be attributed to market appreciation.
ETFs and ETNs closed the month of November at $7.2 billion in assets, a mere $353.8 million, or 0.05%, higher than the $6.8 billion at the end of October. An estimated $231.3 million in net inflows may be attributed to ETNs and ETFs during the month. Refer to Chart 2.
Sustainableinvest.com
Benefits
Free access to regularly updated original research and analysis focused exclusively on sustainable finance and investing, providing investors with the guidance needed to make informed investment decisions that align with their personal values and financial goals while also contributing to the advancement of positive long-term environmental and social outcomes.
By offering financial support for our current work, either in the form of a one-time or regular contributions, you help to defray some of the costs associated with conducting our research and analysis as well as to maintain the www.sustainablest.wpengine.com website.
Helping us to expand our research capabilities and offerings over time to cover additional relevant topics geared to sustainable investors.
Sign up to free newsletters.
By submitting this form, you are consenting to receive marketing emails from: . You can revoke your consent to receive emails at any time by using the SafeUnsubscribe® link, found at the bottom of every email. Emails are serviced by Constant Contact