S&P 500 Registers the Best Monthly Gain of 2.33% Since Recording an Increase of 3.97% in February
Positive earnings results, strong US economic data that seemed to eclipse the effects of hurricanes Harvey and Irma that shut down parts of Texas and Florida in August and September, coupled with an optimistic outlook for tax reform pushed share prices higher in the US. The S&P 500 gained a strong 2.33% during the month of October, registering the best monthly gain since the index recorded an increase of 3.97% in February. This also marked the twelfth straight monthly advance for the S&P500 Index. Emerging markets delivered even stronger results, with the MSCI Emerging Markets Index closing the month up 3.5% while developed markets outside the US, measured by MSCI EAFE Index, ended the month up 1.5%. Bonds in the US edged higher, posting a gain of 0.06% based on the Bloomberg Barclays US Aggregate Bond Index and reversing a decline of 0.48% the prior month. In contrast, sovereign fixed income securities in emerging markets suffered the biggest setback in October, giving up 2.9%.
The third-quarter S&P 500 earnings season kicked off, and at the end of the month, with two-thirds of the companies in the index having reported, year-on-year EPS growth was around 7%, and nearly 5% ex-energy. Although slowing relative to profit gains of more than 10% in the first and second quarters of the year, the results were positive and S&P 500 price levels responded accordingly.
The strong data out of the US in October extended beyond earnings announcements. The Commerce Department reported before the end of the month that Gross Domestic Product (GDP) expanded at the annual rate of 3% in the third quarter. That followed a 3.1% annual growth in the second quarter and marked the first time since mid-2014 that the US economy has posted two consecutive quarters of growth above 3%. Solid spending by consumers and businesses along with higher sales of American goods overseas tempered the effects expected following hurricane Harvey and Irma. Also during the month it was reported that unemployment fell further, with September’s reading dropping to 4.2%—a level last matched in February 2001.
The heartbeat of the US economy, the consumer, was alive and well in October. The University of Michigan Sentiment index for October moved upwards to a reading of 100.7, well above a predicted reading of 95.0. Industrial production showed some recovery from August’s reading of -0.7% to 0.3% for September, showing that the effects of the storms look to be short term. The Philadelphia Fed Business outlook for October reinforced the positive outlook for business investment, coming in at 27.9—well above expectations and last month’s reading.
Outside the US, the International Monetary Fund (IMF) confirmed what the market had already been factoring into stock prices, that global growth of 3.6% is expected in 2017, and 3.7% in 2018, a very slight upward revision from its July forecast. For developing economies, the IMF maintained its 4.6% GDP growth estimate for 2017, but raised it by a tenth of a point to 4.9% for 2018.
Elsewhere, Japan’s electoral outcome in which Prime Minister Shinzo Abe achieved an election victory, helped push its market into the lead over other major regions for October. The Nikkei 225 Average registered a gain of 8.13%, followed by pan-Asia which has largely benefited from the U.S. technology rally. Europe lagged in the month as the region continues to wrestle with Brexit negotiation impasses, Catalonia threatening secession from Spain, and a decidedly populist shift in the Austrian elections following the German elections.
Sustainable Portfolios Posted Positive Results But Underperformed Their Benchmarks
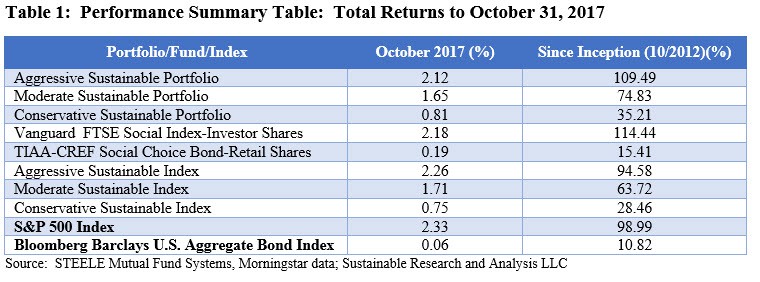
The 15 bps advantage realized by the strong performance of the S&P 500 Index, up 2.33%, relative to the 2.18% gain achieved by the Vanguard FTSE Social Index-Investment Shares, was enough to propel each of the sustainable indexes ahead of the corresponding sustainable portfolios—even as the TIAA-CREF Social Choice Bond Fund-Retail Shares beat the fixed income benchmark by 13 bps.
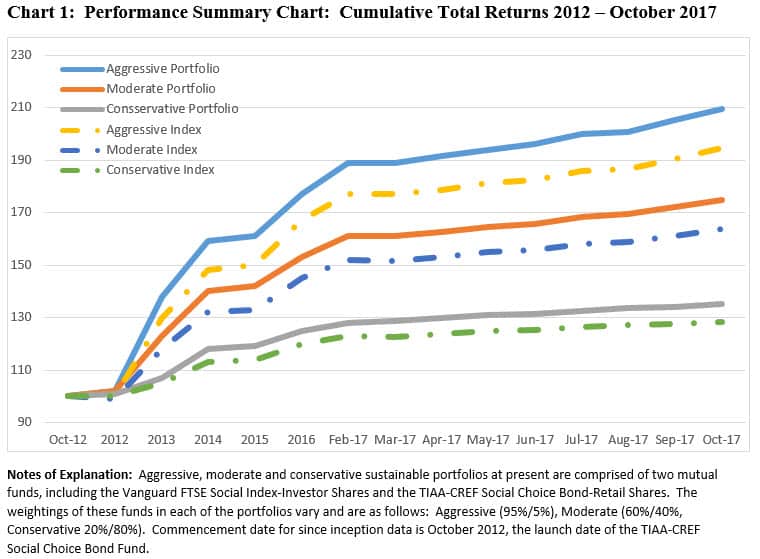
The Aggressive Sustainable Portfolio (95% stocks/5% bonds) posted a gain of 2.12%, followed by more modest gains of 1.65% and 0.81% recorded by the Moderate Sustainable Portfolio (60% stocks/40% bonds) and the Conservative Sustainable Portfolio. Each of the sustainable portfolios lagged their designated indexes.
On a cumulative basis since October 2012, the three portfolios, Aggressive, Moderate and Conservative, are up 109.49%, 74.83% and 35.21%, respectively. The results continue to exceed the total return performance results recorded by their corresponding indexes that are up 94.58%, 63.72% and 28.46% while the relative month-over-month performance advantage enjoyed by the three portfolios remains unchanged. Refer to Table 1 and Chart 1.


Significant Variation in Performance Observed in September Across Sustainable Funds
Within a universe of 752 sustainable funds, including mutual funds, exchange-traded funds (ETFs) and exchange-traded notes (ETNs) and their corresponding share classes, returns for the month of October averaged 1.62% and ranged from a low of -2.75% to a high of 10.48% achieved by the Guggenheim Solar ETF. Refer to Table 2.

Sustainable Funds Add $10.3 Billion in Assets Largely due to the Reclassification of ESG Funds and Market Appreciation
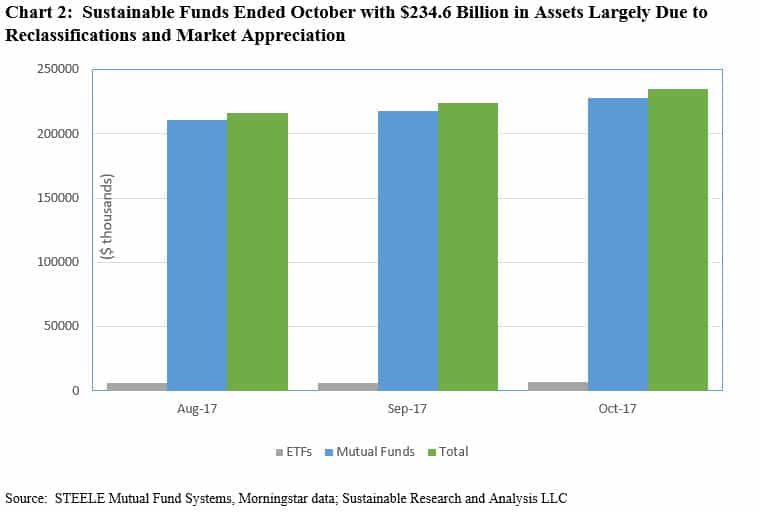
The net assets of sustainable funds, including mutual funds, ETFs and ETNs, ended the month of October with $234.6 billion in net assets, up $10.3 billion or 4.6% for the month. Of the gain, $9.9 billion, or 96%, was sourced to mutual fund assets under management. The increase, however, was not sourced to new cash flows. Rather, it was largely attributable to the reclassification of 67 existing funds/share classes managed by Morgan Stanley ($3.2 billion) and Hartford ($3.0 billion) that are now listed as SRI funds, and market appreciation in October, estimated at about $ 4.0 billion. Refer to Chart 2.
ETFs and ETNs ended the month of October with $6,805.5 million in net assets, up from $6,397 million in September, or an increase of $408.4 million or 6.4%.
Stock and other investments dominate the combined sector, accounting for $209.3 billion in assets at the end of October while fixed fund assets, including taxable and tax-exempt, stood at $18.5 billion. Actively managed assets dominate, representing 93% of the assets allocated to sustainable mutual funds, ETFs and ETNs.

Sustainable Portfolios Performance Summary: October 2017
Positive earnings results, strong US economic data that seemed to eclipse the effects of hurricanes Harvey and Irma that shut down parts of Texas and Florida in August and September, coupled with an optimistic outlook for tax reform pushed share prices higher in the US. The S&P 500 gained a strong 2.33% during the month…
Share This Article:
S&P 500 Registers the Best Monthly Gain of 2.33% Since Recording an Increase of 3.97% in February
Positive earnings results, strong US economic data that seemed to eclipse the effects of hurricanes Harvey and Irma that shut down parts of Texas and Florida in August and September, coupled with an optimistic outlook for tax reform pushed share prices higher in the US. The S&P 500 gained a strong 2.33% during the month of October, registering the best monthly gain since the index recorded an increase of 3.97% in February. This also marked the twelfth straight monthly advance for the S&P500 Index. Emerging markets delivered even stronger results, with the MSCI Emerging Markets Index closing the month up 3.5% while developed markets outside the US, measured by MSCI EAFE Index, ended the month up 1.5%. Bonds in the US edged higher, posting a gain of 0.06% based on the Bloomberg Barclays US Aggregate Bond Index and reversing a decline of 0.48% the prior month. In contrast, sovereign fixed income securities in emerging markets suffered the biggest setback in October, giving up 2.9%.
The third-quarter S&P 500 earnings season kicked off, and at the end of the month, with two-thirds of the companies in the index having reported, year-on-year EPS growth was around 7%, and nearly 5% ex-energy. Although slowing relative to profit gains of more than 10% in the first and second quarters of the year, the results were positive and S&P 500 price levels responded accordingly.
The strong data out of the US in October extended beyond earnings announcements. The Commerce Department reported before the end of the month that Gross Domestic Product (GDP) expanded at the annual rate of 3% in the third quarter. That followed a 3.1% annual growth in the second quarter and marked the first time since mid-2014 that the US economy has posted two consecutive quarters of growth above 3%. Solid spending by consumers and businesses along with higher sales of American goods overseas tempered the effects expected following hurricane Harvey and Irma. Also during the month it was reported that unemployment fell further, with September’s reading dropping to 4.2%—a level last matched in February 2001.
The heartbeat of the US economy, the consumer, was alive and well in October. The University of Michigan Sentiment index for October moved upwards to a reading of 100.7, well above a predicted reading of 95.0. Industrial production showed some recovery from August’s reading of -0.7% to 0.3% for September, showing that the effects of the storms look to be short term. The Philadelphia Fed Business outlook for October reinforced the positive outlook for business investment, coming in at 27.9—well above expectations and last month’s reading.
Outside the US, the International Monetary Fund (IMF) confirmed what the market had already been factoring into stock prices, that global growth of 3.6% is expected in 2017, and 3.7% in 2018, a very slight upward revision from its July forecast. For developing economies, the IMF maintained its 4.6% GDP growth estimate for 2017, but raised it by a tenth of a point to 4.9% for 2018.
Elsewhere, Japan’s electoral outcome in which Prime Minister Shinzo Abe achieved an election victory, helped push its market into the lead over other major regions for October. The Nikkei 225 Average registered a gain of 8.13%, followed by pan-Asia which has largely benefited from the U.S. technology rally. Europe lagged in the month as the region continues to wrestle with Brexit negotiation impasses, Catalonia threatening secession from Spain, and a decidedly populist shift in the Austrian elections following the German elections.
Sustainable Portfolios Posted Positive Results But Underperformed Their Benchmarks
The 15 bps advantage realized by the strong performance of the S&P 500 Index, up 2.33%, relative to the 2.18% gain achieved by the Vanguard FTSE Social Index-Investment Shares, was enough to propel each of the sustainable indexes ahead of the corresponding sustainable portfolios—even as the TIAA-CREF Social Choice Bond Fund-Retail Shares beat the fixed income benchmark by 13 bps.
The Aggressive Sustainable Portfolio (95% stocks/5% bonds) posted a gain of 2.12%, followed by more modest gains of 1.65% and 0.81% recorded by the Moderate Sustainable Portfolio (60% stocks/40% bonds) and the Conservative Sustainable Portfolio. Each of the sustainable portfolios lagged their designated indexes.
On a cumulative basis since October 2012, the three portfolios, Aggressive, Moderate and Conservative, are up 109.49%, 74.83% and 35.21%, respectively. The results continue to exceed the total return performance results recorded by their corresponding indexes that are up 94.58%, 63.72% and 28.46% while the relative month-over-month performance advantage enjoyed by the three portfolios remains unchanged. Refer to Table 1 and Chart 1.
Significant Variation in Performance Observed in September Across Sustainable Funds
Within a universe of 752 sustainable funds, including mutual funds, exchange-traded funds (ETFs) and exchange-traded notes (ETNs) and their corresponding share classes, returns for the month of October averaged 1.62% and ranged from a low of -2.75% to a high of 10.48% achieved by the Guggenheim Solar ETF. Refer to Table 2.
Sustainable Funds Add $10.3 Billion in Assets Largely due to the Reclassification of ESG Funds and Market Appreciation
The net assets of sustainable funds, including mutual funds, ETFs and ETNs, ended the month of October with $234.6 billion in net assets, up $10.3 billion or 4.6% for the month. Of the gain, $9.9 billion, or 96%, was sourced to mutual fund assets under management. The increase, however, was not sourced to new cash flows. Rather, it was largely attributable to the reclassification of 67 existing funds/share classes managed by Morgan Stanley ($3.2 billion) and Hartford ($3.0 billion) that are now listed as SRI funds, and market appreciation in October, estimated at about $ 4.0 billion. Refer to Chart 2.
ETFs and ETNs ended the month of October with $6,805.5 million in net assets, up from $6,397 million in September, or an increase of $408.4 million or 6.4%.
Stock and other investments dominate the combined sector, accounting for $209.3 billion in assets at the end of October while fixed fund assets, including taxable and tax-exempt, stood at $18.5 billion. Actively managed assets dominate, representing 93% of the assets allocated to sustainable mutual funds, ETFs and ETNs.
Sustainableinvest.com
Benefits
Free access to regularly updated original research and analysis focused exclusively on sustainable finance and investing, providing investors with the guidance needed to make informed investment decisions that align with their personal values and financial goals while also contributing to the advancement of positive long-term environmental and social outcomes.
By offering financial support for our current work, either in the form of a one-time or regular contributions, you help to defray some of the costs associated with conducting our research and analysis as well as to maintain the www.sustainablest.wpengine.com website.
Helping us to expand our research capabilities and offerings over time to cover additional relevant topics geared to sustainable investors.
Sign up to free newsletters.
By submitting this form, you are consenting to receive marketing emails from: . You can revoke your consent to receive emails at any time by using the SafeUnsubscribe® link, found at the bottom of every email. Emails are serviced by Constant Contact