Summary
- The three sustainable model portfolios, which throughout 2017 were composed of only two funds that tracked the domestic equity and bond markets, have been reconstituted to include a third fund to capture the performance of international developed markets. The aggressive, moderate and conservative sustainable model portfolios generated gains of 5.34%, 3.79% and 1.07%, respectively.
- The S&P 500 Index recorded a strong start to the year, posting a 5.73% gain during the month of January, the best since March 2016, even after stocks tumbled on the next to last trading day of the month and giving up some 1.01%.
- Against this backdrop, the SUSTAIN Large Cap Equity Fund Index posted a strong 5.47% total return in January but lagged the S&P 500 Index by 26 bps while the universe of 778 sustainable equity and bond funds posted an average gain of 3.95%.
- Sustainable funds, including mutual funds, exchange-traded funds (ETFs) and exchange-traded notes (ETNs) gained $14.4 billion in net assets in January to reach $264.8 billion, or an increase of 5.7%. This gain was largely driven by strong capital appreciation/depreciation experienced during the month of January, notwithstanding the month-end pull back, net new money as well as the repurposing of existing funds.
Even as Stocks Tumbled on January 30, the S&P 500 Index Recorded a Strong Start to the Year, Posting a Gain of 5.73%
[ihc-hide-content ihc_mb_type=”show” ihc_mb_who=”3,4,5″ ihc_mb_template=”4″ ]
The S&P 500 Index recorded a strong start to the year, posting a 5.73% gain during the month of January, the best since March 2016, even after stocks tumbled on the next to last trading day of the month and gave up some 1.01%. Up to January 30, the S&P had notched 14 record closes over the course of the month[1]. The stock market continued to benefit from investor expectations for continued economic growth in the US and abroad and higher corporate earnings bolstered by the passage of the Tax Cuts and Jobs Act of 2017. Even a short-lived government shutdown which was ended with a three-week spending bill extension passed by Congress after the close of trading on January 22nd was not enough to derail the market. This was not the case, however, when concerns about interest rates, inflation, higher government deficits and higher national debt in the longer-term, surfaced at the end of the month and stocks reversed course. As for bonds, the Federal Reserve held interest rates steady at its first meeting of the year. Still, 10-year Treasury note yields ended the month at 2.72%, up 32 basis points since the start of the year. In the process, investment grade bonds, as measured by the Bloomberg Barclays U.S. Aggregate Bond Index, gave up 1.15%, the worst monthly decline since a drop of 2.27% in November 2016. Emerging market stocks, like the S&P 500, recorded their best month since March 2016, registering a gain of 8.3% on the back of World Bank growth estimates released in early January for emerging markets and developing economies as a whole that are projected to strengthen to 4.5% in 2018. The second best monthly gain across the major asset classes was generated by crude oil which was up 7.2% for the month while developed markets gained 5.02% as measured by the MSCI EAFE Index.
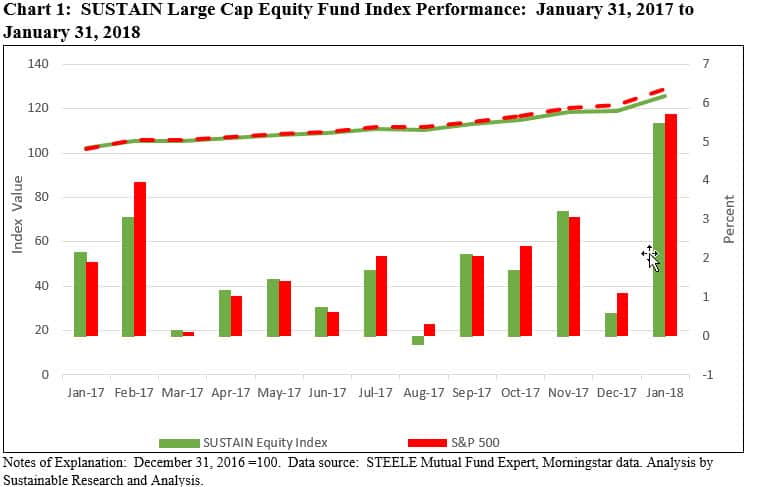
Against this backdrop, the SUSTAIN Large Cap Equity Fund Index, which tracks the total return performance of the ten largest actively managed large cap US oriented equity mutual funds that employ a sustainable investing strategy beyond absolute reliance on exclusionary practices, posted a strong 5.47% total return in January but lagged the S&P 500 Index by 26 bps. Refer to Chart 1. Yet, this was the best result achieved by the SUSTAIN Index since calculations were initiated as of January 2017. Five funds exceeded the performance of the index itself while 4 funds eclipsed the gain achieved by the S&P 500.
Sustainable Portfolios Reconstituted for 2018, Adding International Developed Markets Equity Exposure
The three sustainable model portfolios, which throughout 2017 were composed of only two funds that tracked the domestic equity and bond markets, have been reconstituted to include a third fund to capture the performance of international developed markets. The third fund is the Domini Impact International Equity Investor Shares, which at almost $1.4 billion in total net assets across its 3 share classes, is one of the largest international sustainable funds available to retail and institutional investors. Managed by Domini Impact Investments and sub-advised by Wellington Management Company LLP, the fund has produced superior short and long-term performance results, net of fees, which tend to be higher, by combining, first and foremost, social and environmental standards and the application of quantitative stock selection modeling across a universe of international large cap and mid-cap companies.
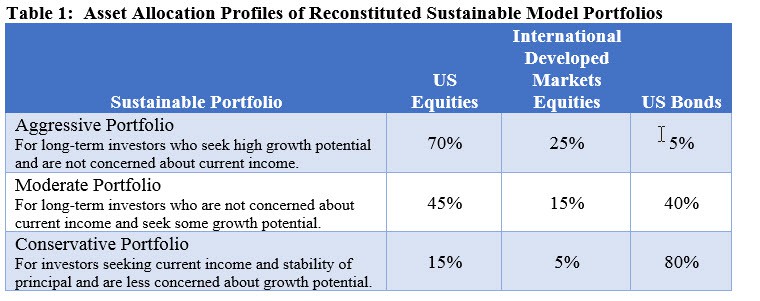
With this reconstitution, each of the three model portfolios preserve their overall equity to fixed income allocation while at the same time introducing international equity exposure to each portfolio. Accordingly, the Aggressive Sustainable Portfolio still consists of 95% stocks and 5% bonds but the stock component has been reallocated to include 70% US equities and 25% international equities. The Moderate Sustainable Portfolio still maintains its 60% stocks/40% bonds allocation but the stock component has been reallocated to include 45% US equities and 15% international equities. Lastly, the Conservative Sustainable Portfolio still maintains a 20% stocks/80% bonds allocation but the stock component has been reallocated to include 15% US equities and 5% international equities. Refer to Table 1.
Two of Three Sustainable Portfolios Post Results in Excess of Corresponding non-ESG Indexes
In line with the performance of stocks and bonds that moved in opposite directions in January, the two sustainable equity funds that comprise the sustainable model portfolios produced positive results while the bond fund posted a decline. Moreover, two of the three funds, namely the Domini Impact International Equity Investor Shares, up 6.05%, and TIAA-CREFF Social Choice Bond Retail share class, which registered a decline of -0.97%, outperformed their corresponding non-ESG index during the month of January. At the same time, the Vanguard FTSE Social Index-Investor Shares, which recorded a gain of 5.38%, lagged behind the S&P 500 by 35 basis points. As a result, the Aggressive Sustainable Portfolio, dominated by its 70% exposure to US equities via the Vanguard FTSE Social Index Fund, was the only one to lag its corresponding non-ESG index for the month. The Aggressive Sustainable Portfolio recorded a gain of 5.34% versus an increase of 5.38% for its corresponding non-ESG index. The Moderate Sustainable Portfolio, as well as the Conservative Sustainable Portfolio, posted gains of 3.79% and 1.07% versus 3.73% and 0.90% for their corresponding indexes, respectively. Refer to Table 2.
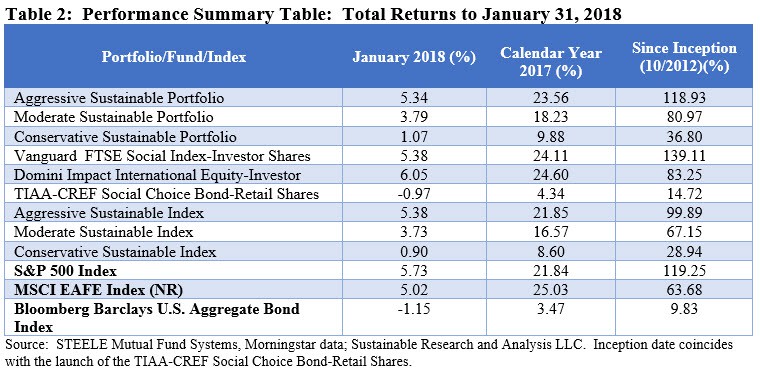
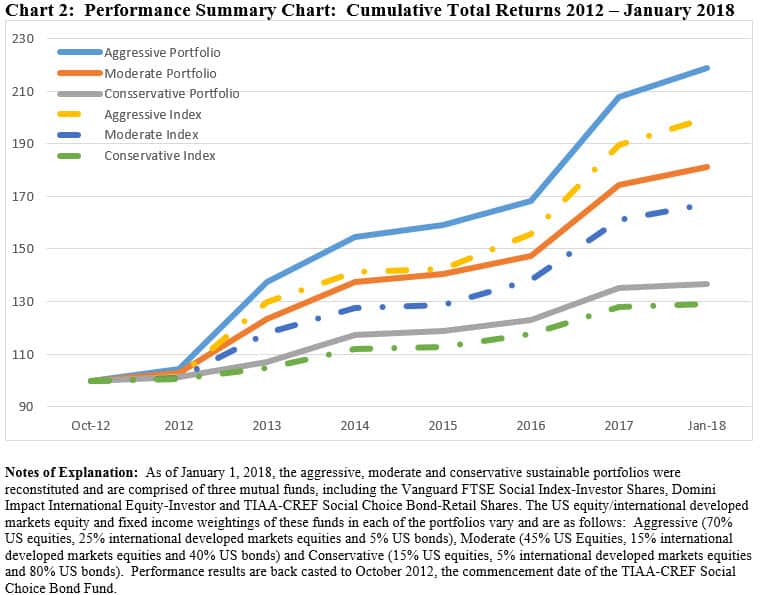
The performance of the reconstituted model portfolios was recast to October 2012. Each of the sustainable portfolios outperformed their corresponding indexes on a cumulative basis by margins of 7.86% for the Conservative Sustainable Portfolio, to 13.8% for the Moderate Sustainable Portfolio to 19.04% attributable to the Aggressive Sustainable Portfolio. Furthermore, while two of the reconstituted portfolios, namely the aggressive and moderate portfolios, lag their previous two fund model portfolio counterparts since inception, in each case the results are achieved with lower levels of volatility or risk during the interval between 2012 and January 2018. Refer to Chart 2.
Sustainable Funds Post an Average Gain of 3.95% in January, Ranging from -1.58% to 15.03%
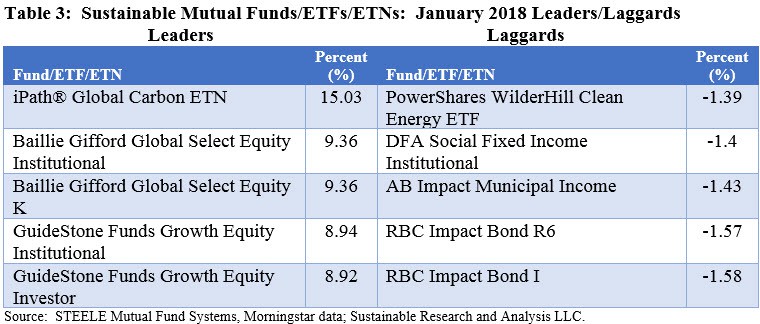
Within a universe of 778 sustainable funds, including mutual funds, exchange-traded funds (ETFs) and exchange-traded notes (ETNs) and their corresponding share classes, returns for the month of December averaged 3.95%, ranging from a high of 15.03% achieved by the iPath Global Carbon ETN, an exchange-traded note that provides exposure to the global price of carbon by referencing the price of carbon emissions credits from the world’s major emissions related mechanisms and which has led for the second consecutive month, to a low of -1.58% posted by RBC Impact Bond I. Refer to Table 3.
Sustainable Funds Total Net Assets Reach Another Peak Level of $264.8 Billion, Largely on the Basis of Market Appreciation but also Net New Money Fund Reclassifications
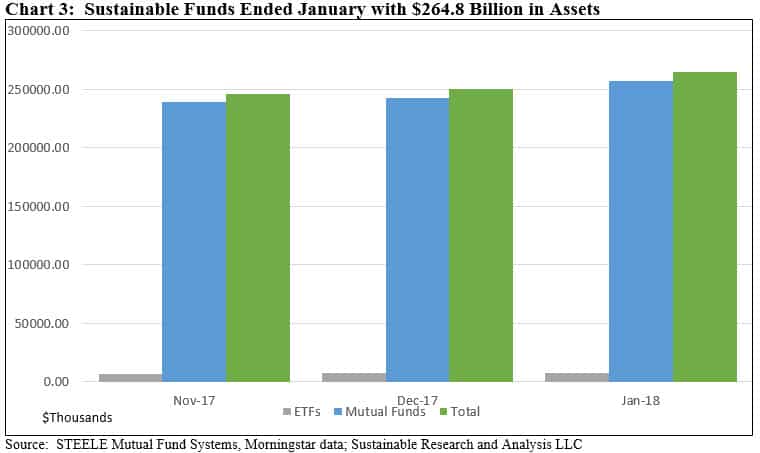
After ending the year at $250.4 billion in assets under management across 774 funds, sustainable funds, including mutual funds, exchange-traded funds (ETFs) and exchange-traded notes (ETNs) gained $14.4 billion in January 2018 and reached $264.8 billion, for an increase of 5.7%. This gain was largely driven by strong capital appreciation/depreciation experienced during the month of January, notwithstanding the month-end pull back, net new money as well as the repurposing of existing funds. Over the trailing three months, sustainable funds added $30.2 billion in net assets. Refer to Chart 3.
Sustainable mutual funds ended the month with $257.1 billion, accounting for 97% of assets in this segment while ETFs and ETNs closed the month of January with $7.7 billion. The assets of sustainable mutual funds experienced an increase of $14.2 billion, or 5.8% as compared to ETFs/ETNs that added just $411.4 million, or a gain of 5.7%.
An estimated $11.8 billion, or 83% of the gain, is attributable to net capital appreciation. Further, 2 funds and their 11 corresponding share classes were reclassified or repurposed, for a total of $1.01billion. These funds accounted for 7.1% of the monthly uptick. After accounting for capital appreciation and reclassifications, an estimated $1.4 billion in net new cash flowed into the sustainable funds segment, for a month-over-month increase of 0.6%.
[1] Stocks went on to post an even sharper reversal for a 10% correction in early February.
[/ihc-hide-content]


