Summary
Stocks recorded new highs throughout the year. The S&P 500 Index posted a full year total return gain of 21.83% while emerging markets delivered an even greater 32.38% gain. Bonds turned in the second best performance in the last five years. Against a goldilocks backdrop, sustainable oriented funds, defined as actively managed mutual funds that employ a sustainable investing strategy beyond absolute reliance on exclusionary practices, also performed well on an absolute basis and in some cases on a relative basis as well. Domestic large cap sustainable equity funds lagged the S&P 500, but a cohort of sustainable bond funds and world funds beat non-ESG benchmarks. Sustainable Portfolios also posted strong results for calendar year 2017. But given the outstanding performance results, sustainable funds didn’t manage to attract new assets, ending the year higher at $250.4 billion largely due to capital appreciation and sustainable fund strategy reclassifications.
Stocks recorded new record highs throughout the year: The S&P 500 Index added 1.11% in December and posted a full year total return gain of 21.83% with limited volatility
Bolstered by positive economic data in the US and abroad, steady job growth, rising corporate earnings, accelerated manufacturing activity and at first the potential for and finally adoption of legislative tax cuts, investors overcame geopolitical uncertainties to drive stocks to new record highs throughout the year. The S&P 500 Index added 1.11% in December and posted a full year total return gain of 21.83% with limited volatility. This is almost double last year’s 11.96% gain and the third best increase in the last decade when higher returns were registered in 2009, following the financial crisis (+26.46%) and 2013 at which time the index gained 32.38%.
The Dow Jones Industrial Average closed the year even higher, posting a gain of 25.1% versus last year’s increase of 13.4%. Even such stellar results, however, were eclipsed by the performance of the technology heavy Nasdaq 100, up 32.99%, and emerging markets, measured by the MSCI Emerging Markets Index, which delivered an even greater 37.3% return and posted the best increase since 2009 as well as the highest across the major assets classes.
Bonds turned in the second best performance in the last five years. In a year when three Federal Reserve rate hikes, the last of which occurred in December when the Federal Open Market Committee raised the target range of its benchmark short-term interest rate to between 1.00% and 1.25% and the yield on the 10-Year Treasury Note moved within a narrow range between 2.446% at the end of 2016 to end the year at 2.409%, investment grade bonds turned in a gain of 3.54%. This exceeded last year’s 2.65% increase and represents the second best performance in the last five years for the Bloomberg Barclay’s U.S. Aggregate Bond Index.
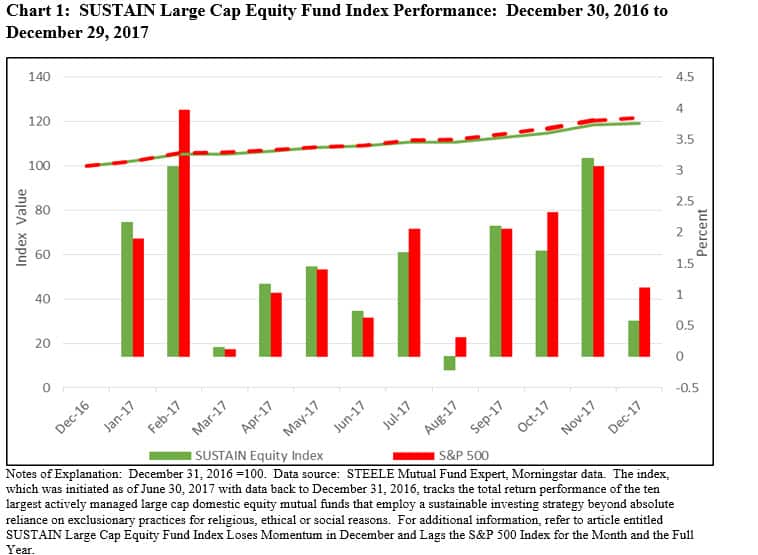
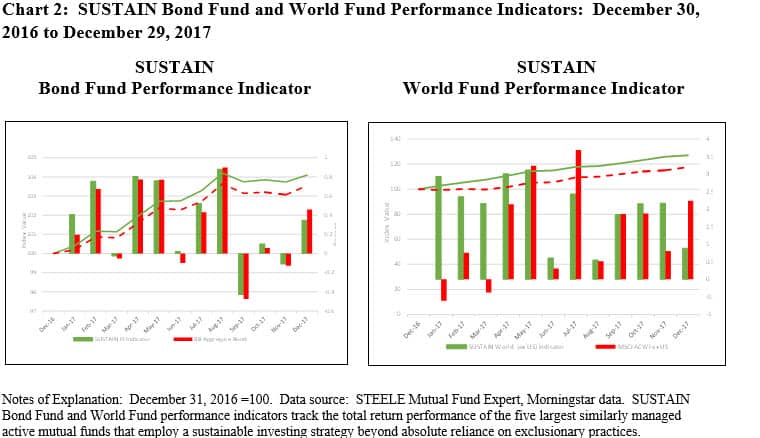
Against this goldilocks backdrop, sustainable oriented funds, defined here as actively managed mutual funds that employ a sustainable investing strategy beyond absolute reliance on exclusionary practices, also performed well on an absolute basis and in some cases also on a relative basis. The SUSTAIN Large Cap Equity Fund Index, which tracks the total return performance of the ten largest actively managed large cap US oriented sustainable equity mutual funds, gained 19.25% but lagged the S&P 500 by 265 basis points (bps). At the same time, smaller cohorts of sustainable bond funds and world funds, including developed and developing countries, ex USA, consisting in each case of five actively managed funds with similar investment objectives, produced superior relative results. The SUSTAIN Bond Fund Indicator and SUSTAIN World Fund Indicator were up 4.09% relative to the Bloomberg Barclay’s U.S. Aggregate Bond Index, or an excess return of 55 basis points and 27.05% relative to the MSCI All Country World Index ex USA (MSCI ACWI ex USA), or an excess return of 940 basis points. Refer to Chart 1 and Chart 2.
Even after ending an outstanding year, the outlook for financial markets is clouded by a number of concerns and uncertainties: the high valuation of equities, the nature of the economic stimulus and impact on inflation, which is likely to move higher, as well as corporate earnings that will be realized from the Republican led tax cut and consequently, the likely direction of interest rates, as well as domestic and foreign political tensions. So far in 2018, the market is pushing ahead with the S&P 500 Index closing at yet another new record as of January 8, 2018.
Sustainable Portfolios Post Strong Results for Calendar Year 2017 on the Back of Excess Benchmark Returns Achieved by Underlying Sustainable Mutual Funds
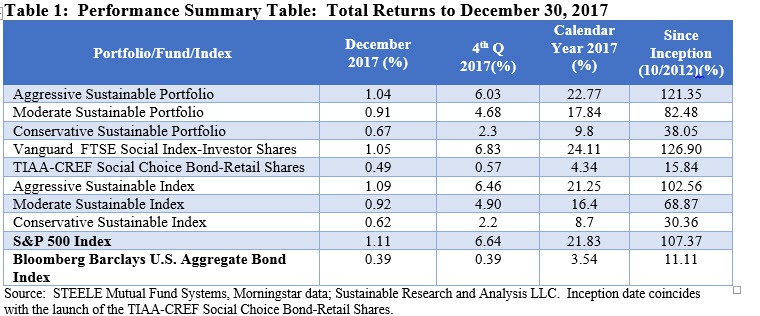
The Aggressive Sustainable Portfolio (95% stocks/5% bonds), Moderate Sustainable Portfolio (60% stocks/40% bonds) and the Conservative Sustainable Portfolio (20%/80%) exceeded the performance of their corresponding non-ESG indexes during calendar year 2017 due to the benchmark beating results achieved by both of the underlying Vanguard FTSE Social Index-Investor Shares and TIAA-CREF Social Choice Bond-Retail Shares. The three portfolios beat their underlying indexes by 152 bps, 144 bps and 110 bps, respectively. A similar outcome was achieved since the inception date for the creation of these three portfolios as of October 2012, again benefiting from the benchmark beating results achieved by the FTSE Social Index-Investor Shares and Social Choice Bond-Retail Shares during this longer interval.
At the same time, the results for the month of December were mixed. The Vanguard FTSE Social Index-Investor Shares fell behind the S&P 500 Index in December by 6 basis points while the TIAA-CREF Social Choice Bond-Retail Shares exceeded the performance of the Bloomberg Barclays U.S. Aggregate Bond Index by 18 basis points. These results negatively impacted the stock heavy Aggressive Sustainable Portfolio but had a positive outcome on the Conservative Sustainable Portfolio with its heavy concentration in bonds.
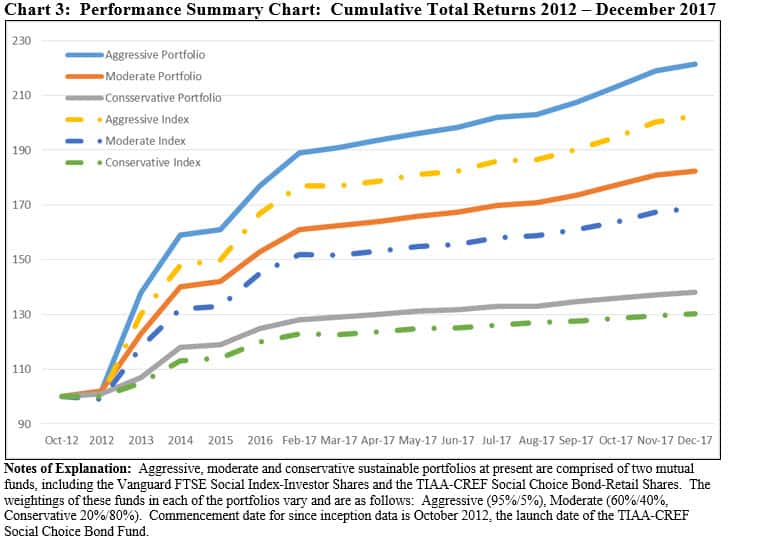
The total return performance results achieved by the three portfolios since inception illustrates the significant positive impact that a bull market in stocks can have over time while also focusing attention on the relative underperformance of a bond heavy portfolio. The Aggressive Sustainable Portfolio posted a gain of 121.35% since October 2012 while the Conservative Sustainable Portfolio posted a gain of 30.36%, or one-fourth of the former. Of course, while a long-term investment time horizon matters, the selected time interval can have a significant impact on performance results which is best mitigated by staying the course and remaining invested through a complete market cycle.
Sustainable Funds Post an Average Gain of 1.17% in December and 20.32% for the year 2017
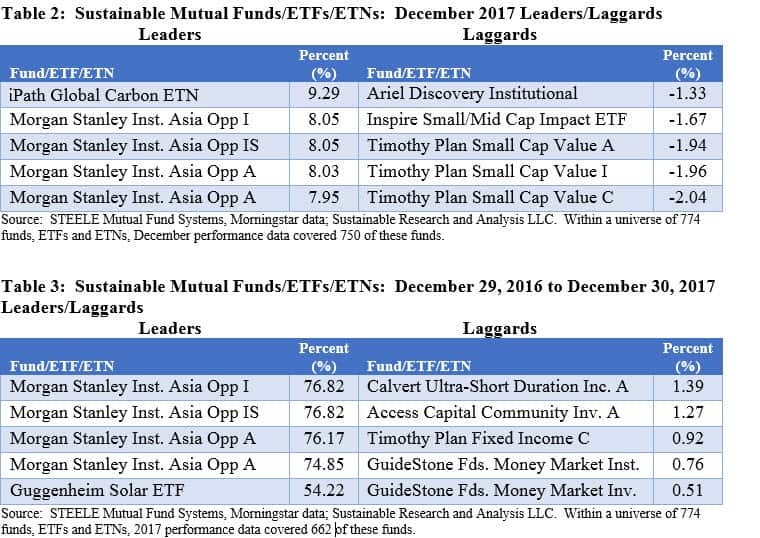
Within a universe of 750 sustainable funds, including mutual funds, exchange-traded funds (ETFs) and exchange-traded notes (ETNs) and their corresponding share classes, returns for the month of December averaged 1.17%, ranging from a high of 9.29% achieved by the iPath Global Carbon ETN, an exchange-traded note that provides exposure to the global price of carbon by referencing the price of carbon emissions credits from the world’s major emissions related mechanisms, to a low of -2.04% posted by Timothy Plan Small Cap Value C. Refer to Table 2.
Similarly, across 662 funds, including mutual funds, exchange-traded funds (ETFs) and exchange-traded notes (ETNs) and their corresponding share classes, returns for the calendar year averaged 20.32% and ranged from eye popping highs recorded by the same four share classes of the Morgan Stanley Institutional Asia Opportunity Fund that achieved some of the best results in December, ranging from 76.82% to 74.85%, due to varying expense ratios to a low of 51 basis points registered by GuideStone Funds Money Market Investor. Refer to Table 3.
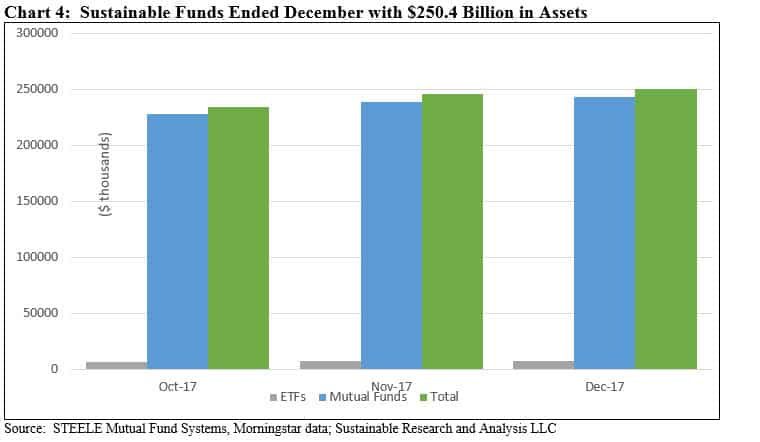
Sustainable Funds’ Total Net Assets End the Month and Year at a Peak Level of $250.4 Billion, Largely on the Basis of Market Appreciation and Fund Reclassifications
The net assets of sustainable funds, including mutual funds, ETFs and ETNs, ended the month of December and the full year at $250.4 billion in net assets, marking a peak level for assets linked to sustainable investing strategies.
Sustainable funds added $4.1 billion, largely due to gains recorded by mutual funds which saw an increase in market value to $246.3 billion, or a 1.7% gain relative to November when sustainable mutual funds alone stood at $239.1 billion. December cash flows were negative after accounting for market appreciation. During the 4th quarter, sustainable funds added $26.1 billion, but this uptick was largely attributable to capital appreciation and fund strategy reclassifications. Refer to Chart 4.
Sustainable fund assets started the year at $193.1 billion, increasing by $57.3 billion, or about 30%. Of this sum, all but about $3.0 billion is attributable to capital appreciation and fund strategy reclassifications.
Sustainable Portfolios Performance Summary: December 2017
Summary Stocks recorded new highs throughout the year. The S&P 500 Index posted a full year total return gain of 21.83% while emerging markets delivered an even greater 32.38% gain. Bonds turned in the second best performance in the last five years. Against a goldilocks backdrop, sustainable oriented funds, defined as actively managed mutual funds…
Share This Article:
Summary
Stocks recorded new highs throughout the year. The S&P 500 Index posted a full year total return gain of 21.83% while emerging markets delivered an even greater 32.38% gain. Bonds turned in the second best performance in the last five years. Against a goldilocks backdrop, sustainable oriented funds, defined as actively managed mutual funds that employ a sustainable investing strategy beyond absolute reliance on exclusionary practices, also performed well on an absolute basis and in some cases on a relative basis as well. Domestic large cap sustainable equity funds lagged the S&P 500, but a cohort of sustainable bond funds and world funds beat non-ESG benchmarks. Sustainable Portfolios also posted strong results for calendar year 2017. But given the outstanding performance results, sustainable funds didn’t manage to attract new assets, ending the year higher at $250.4 billion largely due to capital appreciation and sustainable fund strategy reclassifications.
Stocks recorded new record highs throughout the year: The S&P 500 Index added 1.11% in December and posted a full year total return gain of 21.83% with limited volatility
Bolstered by positive economic data in the US and abroad, steady job growth, rising corporate earnings, accelerated manufacturing activity and at first the potential for and finally adoption of legislative tax cuts, investors overcame geopolitical uncertainties to drive stocks to new record highs throughout the year. The S&P 500 Index added 1.11% in December and posted a full year total return gain of 21.83% with limited volatility. This is almost double last year’s 11.96% gain and the third best increase in the last decade when higher returns were registered in 2009, following the financial crisis (+26.46%) and 2013 at which time the index gained 32.38%.
The Dow Jones Industrial Average closed the year even higher, posting a gain of 25.1% versus last year’s increase of 13.4%. Even such stellar results, however, were eclipsed by the performance of the technology heavy Nasdaq 100, up 32.99%, and emerging markets, measured by the MSCI Emerging Markets Index, which delivered an even greater 37.3% return and posted the best increase since 2009 as well as the highest across the major assets classes.
Bonds turned in the second best performance in the last five years. In a year when three Federal Reserve rate hikes, the last of which occurred in December when the Federal Open Market Committee raised the target range of its benchmark short-term interest rate to between 1.00% and 1.25% and the yield on the 10-Year Treasury Note moved within a narrow range between 2.446% at the end of 2016 to end the year at 2.409%, investment grade bonds turned in a gain of 3.54%. This exceeded last year’s 2.65% increase and represents the second best performance in the last five years for the Bloomberg Barclay’s U.S. Aggregate Bond Index.
Against this goldilocks backdrop, sustainable oriented funds, defined here as actively managed mutual funds that employ a sustainable investing strategy beyond absolute reliance on exclusionary practices, also performed well on an absolute basis and in some cases also on a relative basis. The SUSTAIN Large Cap Equity Fund Index, which tracks the total return performance of the ten largest actively managed large cap US oriented sustainable equity mutual funds, gained 19.25% but lagged the S&P 500 by 265 basis points (bps). At the same time, smaller cohorts of sustainable bond funds and world funds, including developed and developing countries, ex USA, consisting in each case of five actively managed funds with similar investment objectives, produced superior relative results. The SUSTAIN Bond Fund Indicator and SUSTAIN World Fund Indicator were up 4.09% relative to the Bloomberg Barclay’s U.S. Aggregate Bond Index, or an excess return of 55 basis points and 27.05% relative to the MSCI All Country World Index ex USA (MSCI ACWI ex USA), or an excess return of 940 basis points. Refer to Chart 1 and Chart 2.
Even after ending an outstanding year, the outlook for financial markets is clouded by a number of concerns and uncertainties: the high valuation of equities, the nature of the economic stimulus and impact on inflation, which is likely to move higher, as well as corporate earnings that will be realized from the Republican led tax cut and consequently, the likely direction of interest rates, as well as domestic and foreign political tensions. So far in 2018, the market is pushing ahead with the S&P 500 Index closing at yet another new record as of January 8, 2018.
Sustainable Portfolios Post Strong Results for Calendar Year 2017 on the Back of Excess Benchmark Returns Achieved by Underlying Sustainable Mutual Funds
The Aggressive Sustainable Portfolio (95% stocks/5% bonds), Moderate Sustainable Portfolio (60% stocks/40% bonds) and the Conservative Sustainable Portfolio (20%/80%) exceeded the performance of their corresponding non-ESG indexes during calendar year 2017 due to the benchmark beating results achieved by both of the underlying Vanguard FTSE Social Index-Investor Shares and TIAA-CREF Social Choice Bond-Retail Shares. The three portfolios beat their underlying indexes by 152 bps, 144 bps and 110 bps, respectively. A similar outcome was achieved since the inception date for the creation of these three portfolios as of October 2012, again benefiting from the benchmark beating results achieved by the FTSE Social Index-Investor Shares and Social Choice Bond-Retail Shares during this longer interval.
At the same time, the results for the month of December were mixed. The Vanguard FTSE Social Index-Investor Shares fell behind the S&P 500 Index in December by 6 basis points while the TIAA-CREF Social Choice Bond-Retail Shares exceeded the performance of the Bloomberg Barclays U.S. Aggregate Bond Index by 18 basis points. These results negatively impacted the stock heavy Aggressive Sustainable Portfolio but had a positive outcome on the Conservative Sustainable Portfolio with its heavy concentration in bonds.
The total return performance results achieved by the three portfolios since inception illustrates the significant positive impact that a bull market in stocks can have over time while also focusing attention on the relative underperformance of a bond heavy portfolio. The Aggressive Sustainable Portfolio posted a gain of 121.35% since October 2012 while the Conservative Sustainable Portfolio posted a gain of 30.36%, or one-fourth of the former. Of course, while a long-term investment time horizon matters, the selected time interval can have a significant impact on performance results which is best mitigated by staying the course and remaining invested through a complete market cycle.
Sustainable Funds Post an Average Gain of 1.17% in December and 20.32% for the year 2017
Within a universe of 750 sustainable funds, including mutual funds, exchange-traded funds (ETFs) and exchange-traded notes (ETNs) and their corresponding share classes, returns for the month of December averaged 1.17%, ranging from a high of 9.29% achieved by the iPath Global Carbon ETN, an exchange-traded note that provides exposure to the global price of carbon by referencing the price of carbon emissions credits from the world’s major emissions related mechanisms, to a low of -2.04% posted by Timothy Plan Small Cap Value C. Refer to Table 2.
Similarly, across 662 funds, including mutual funds, exchange-traded funds (ETFs) and exchange-traded notes (ETNs) and their corresponding share classes, returns for the calendar year averaged 20.32% and ranged from eye popping highs recorded by the same four share classes of the Morgan Stanley Institutional Asia Opportunity Fund that achieved some of the best results in December, ranging from 76.82% to 74.85%, due to varying expense ratios to a low of 51 basis points registered by GuideStone Funds Money Market Investor. Refer to Table 3.
Sustainable Funds’ Total Net Assets End the Month and Year at a Peak Level of $250.4 Billion, Largely on the Basis of Market Appreciation and Fund Reclassifications
The net assets of sustainable funds, including mutual funds, ETFs and ETNs, ended the month of December and the full year at $250.4 billion in net assets, marking a peak level for assets linked to sustainable investing strategies.
Sustainable funds added $4.1 billion, largely due to gains recorded by mutual funds which saw an increase in market value to $246.3 billion, or a 1.7% gain relative to November when sustainable mutual funds alone stood at $239.1 billion. December cash flows were negative after accounting for market appreciation. During the 4th quarter, sustainable funds added $26.1 billion, but this uptick was largely attributable to capital appreciation and fund strategy reclassifications. Refer to Chart 4.
Sustainable fund assets started the year at $193.1 billion, increasing by $57.3 billion, or about 30%. Of this sum, all but about $3.0 billion is attributable to capital appreciation and fund strategy reclassifications.
Sustainableinvest.com
Benefits
Free access to regularly updated original research and analysis focused exclusively on sustainable finance and investing, providing investors with the guidance needed to make informed investment decisions that align with their personal values and financial goals while also contributing to the advancement of positive long-term environmental and social outcomes.
By offering financial support for our current work, either in the form of a one-time or regular contributions, you help to defray some of the costs associated with conducting our research and analysis as well as to maintain the www.sustainablest.wpengine.com website.
Helping us to expand our research capabilities and offerings over time to cover additional relevant topics geared to sustainable investors.
Sign up to free newsletters.
By submitting this form, you are consenting to receive marketing emails from: . You can revoke your consent to receive emails at any time by using the SafeUnsubscribe® link, found at the bottom of every email. Emails are serviced by Constant Contact