Summary
- Economic growth momentum and a sturdy fundamental backdrop of strong corporate earnings, low unemployment and contained inflation overcame a number of challenges to bolster stock results in the US. The Federal Reserve also fueled momentum, with news that it remains accommodative on the monetary policy front. Interest rates are being lifted slowly and predictably while the Fed’s balance sheet is being trimmed in a similarly deliberative fashion.
- The SUSTAIN Equity Fund Index gained 2.79% in August, lagging behind the S&P 500 by 47 basis points while the SUSTAIN Bond Fund Indicator recorded an increase of 0.66% in August, beating the Bloomberg Barclays U.S. Aggregate Bond Index. The broadest universe of sustainable funds, a universe of 1,064 mutual funds and ETFs covering all asset classes from money markets to equities, posted a one-month average gain of 0.84%.
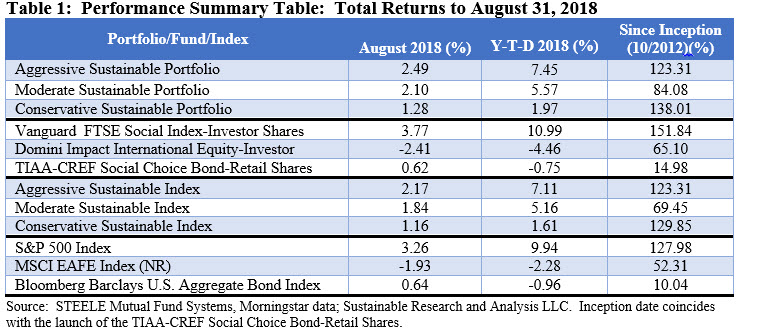
- Model sustainable portfolios posted results in August ranging from 1.28% to 2.49%.
- Sustainable funds closed August at $310.6 billion, with net inflows adding and estimated $2.05 billion, the second highest this year.
Market Commentary: Economic growth momentum and a sturdy fundamental backdrop bolster stock results in the US while the Federal Reserve remains accommodating
The S&P 500 Index posted an above average monthly increase of 3.26% in August, the third best monthly gain so far this year after recording advances of 3.9% in July and 5.47% in January. In fact, the S&P 500 along with the Nasdaq Composite Index both finally surpassed the record closes achieved on January 26th of this year. The Nasdaq Composite Index gained 5.85% while the Dow Jones Industrial Average added 2.2% for the month but it still remained 2.4% short of its high set in January. Growth topped value stocks and small caps eclipsed large cap stocks. At the same time, developed markets outside the US faced headwinds, reflected in the -1.93% decline registered by the MSCI EAFE (Net) Index while emerging markets turned sharply lower, led by sharp falls in the share prices and currencies of Turkey and Argentina that are experiencing severe domestic economic and political reversals. The MSCI Emerging Markets (Net) Index recorded a decline -2.7% while its counterpart Latin American index was down 8.37%.
A sturdy fundamental backdrop of strong corporate earnings, low unemployment and contained inflation bolstered the results achieved in the US, even during a month punctuated by continuing trade policy uncertainties, notwithstanding a trade agreement concluded at month-end between the US and Mexico, and domestic political discord that reached new levels with the conviction and plea agreement reached by two high level Trump associates. As if further validation of factors that have been powering US stock prices was required, the Commerce Department reported just before month-end that its broadest measure of corporate measure of after-tax profits across the US rose 16.1% in the quarter ended June 30 from a year earlier. This was the largest year-over-year gain in six years. At the same time, the Commerce Department also revised upward US economic growth in the second quarter to an annual rate of 4.2% from an earlier estimate of 4.1%. Yet even as the outlook remains positive, the sharp stock run-up over the last two months has left some investors feeling cautious as we enter the month of September and what is considered a more volatile fall interval in global markets.
The Federal Reserve also fueled momentum, with news that it remains accommodative with its monetary policy. Interest rates are being lifted slowly and predictably while its balance sheet is being trimmed in a similarly deliberative fashion. In its release of the minutes from the July 31 to August 1 meeting, the Federal Reserve signaled that it is likely to raise interest rates in September, after raising its benchmark rate the second time this year in June to a range between 1.75% and 2%. Short-term rates ended August at 2.03% while 10-Year US Treasury securities closed the month at 2.86% or 10 basis points lower than the level at July 31. Against this backdrop, the Bloomberg Barclays US Aggregate Bond Index posted a 0.64% gain for the month. This was the benchmark’s best showing since May.
At the same time, the SUSTAIN Equity Fund Index gained 2.79% in August, lagging behind the S&P 500 by 47 basis points while the SUSTAIN Bond Fund Indicator recorded an increase of 0.66% in August, beating the Bloomberg Barclays U.S. Aggregate Bond Index and expanding the year-to-date outperformance by 0.24% or 24 basis points. The broadest universe of sustainable funds, a universe of 1,064 mutual funds and ETFs covering all asset classes from money markets to equities, posted a one-month average gain of 0.84%.
Model portfolios post results in August ranging from 1.28% to 2.49%
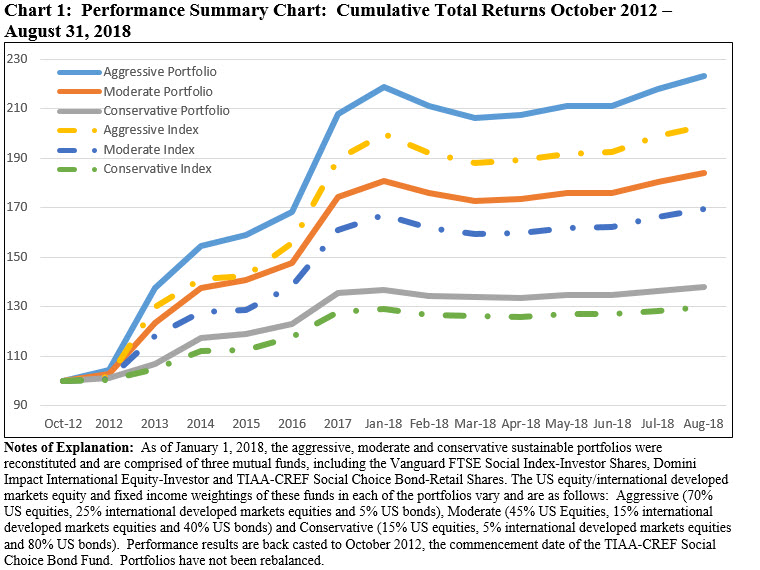
The Aggressive Sustainable Portfolio (95% stocks/5% bonds), Moderate Sustainable Portfolio (60% stocks/40% bonds) and the Conservative Sustainable Portfolio (20%/80%) generated positive results in August, ranging from 1.28% to 2.49%. Each of the portfolios, but in particular the Aggressive and Moderate portfolios with their heavier stock allocations, benefited from the outperformance recorded by the Vanguard FTSE Social Index Fund-Investor Shares that was up 3.77% for the month versus 3.26% for the S&P 500, for a 51 basis points advantage. Refer to Table 1. In the process, the spread between the portfolios and their corresponding benchmarks expanded to the widest levels since inception as of October 2012. These now extend from a low of 8.2% applicable to the Conservative Sustainable Portfolio to 14.6% applicable to the Moderate Sustainable Portfolio and to 20.1% applicable to the Aggressive Sustainable Portfolio. It should be noted that these portfolios have not been rebalanced since their inception dates. Refer to Chart 1.


Even as the Domini Impact International Equity-Investor Shares and TIAA-CREF Social Choice Bond-Retail Shares each slightly underperformed their designated non-sustainable indexes, the Conservative Sustainable, Moderate Sustainable and Aggressive Sustainable portfolios each exceeded the performance of their corresponding benchmarks.
Sustainable funds register an average gain of 0.84%, ranging from 22.48% to -9.76%
Within a universe of 1,064 sustainable funds with performance for the full month, including mutual funds, exchange-traded funds (ETFs) and exchange-traded notes (ETNs) and their corresponding share classes, returns for the month of August, hampered by the performance of non-US stocks, averaged 0.84% versus last month when sustainable funds, on average, posted a gain of 2.14%. A total of 745 funds, or 70%, posted 0.00 to positive results for the month.
The highest return at 22.48% was delivered by the iPath Global Carbon ETN, a $10.8 million exchange-traded note that provides exposure to the global price of carbon by referencing the price of carbon emissions credits from the world’s major emissions related mechanisms. This highly volatile ETN was up +17.2% last month and is up 178.13% year-to-date. The performance of the outlier iPath ETN was followed by the $3.7 million Riverbridge Eco Leaders Fund-Investor Shares that was up 8.2% with the benefit of its technology investments such as Amazon and Microsoft, to mention just two. At the other end of the range, the recently launched $6.4 million Amplify Advanced Battery Metals and Materials ETF, that in addition to various fundamental considerations takes into consideration a company’s environmental, social and governance (ESG) scores, posted a -9.67% decline on the back of weak metals and mining prices and increased volatility. Refer to Table 2.

Sustainable funds close August at $310.6 billion, with net inflows adding and estimated $2.05 billion, the second highest this year
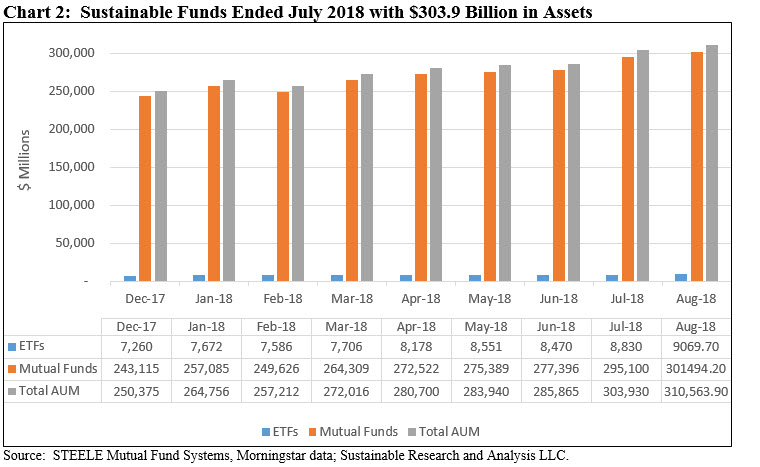
The net assets of 1,066 sustainable funds, including mutual funds, ETFs and ETNs, ended the month of July at $310.6 billion versus $303.9 billion at the end of July. Of the $6.6 billion increase, an estimated $2.9 billion is attributable to market movement driven by economic growth momentum and a sturdy fundamental backdrop of strong corporate earnings, low unemployment and contained inflation, bolstered by an accommodative Federal Reserve which overcame a number of challenges to bolster stock results in the US. Refer to Chart 2.

Three fund firms, including two new entrants, repurposed 4 funds, for a total of 19 share classes, and in the process shifted a total of $1,180.5 million into the sustainable investing sphere. At the same time, the universe of sustainable funds experienced approximately $2.05 billion in net inflows, or 0.7%, the second highest level of inflows so far this year and second only to January’s $2.2 billion.
Mutual funds ended the month at $301.5 billion, comprised of 1,066 funds and share classes, accounting for about 97% of sustainable fund assets and unchanged from the previous month. ETFs and ETNs closed the month with $9.1 billion in assets across 78 ETFs.
Monthly Sustainable Portfolios Performance Summary: August 2018
Summary Economic growth momentum and a sturdy fundamental backdrop of strong corporate earnings, low unemployment and contained inflation overcame a number of challenges to bolster stock results in the US. The Federal Reserve also fueled momentum, with news that it remains accommodative on the monetary policy front. Interest rates are being lifted slowly and predictably…
Share This Article:
Summary
Market Commentary: Economic growth momentum and a sturdy fundamental backdrop bolster stock results in the US while the Federal Reserve remains accommodating
The S&P 500 Index posted an above average monthly increase of 3.26% in August, the third best monthly gain so far this year after recording advances of 3.9% in July and 5.47% in January. In fact, the S&P 500 along with the Nasdaq Composite Index both finally surpassed the record closes achieved on January 26th of this year. The Nasdaq Composite Index gained 5.85% while the Dow Jones Industrial Average added 2.2% for the month but it still remained 2.4% short of its high set in January. Growth topped value stocks and small caps eclipsed large cap stocks. At the same time, developed markets outside the US faced headwinds, reflected in the -1.93% decline registered by the MSCI EAFE (Net) Index while emerging markets turned sharply lower, led by sharp falls in the share prices and currencies of Turkey and Argentina that are experiencing severe domestic economic and political reversals. The MSCI Emerging Markets (Net) Index recorded a decline -2.7% while its counterpart Latin American index was down 8.37%.
A sturdy fundamental backdrop of strong corporate earnings, low unemployment and contained inflation bolstered the results achieved in the US, even during a month punctuated by continuing trade policy uncertainties, notwithstanding a trade agreement concluded at month-end between the US and Mexico, and domestic political discord that reached new levels with the conviction and plea agreement reached by two high level Trump associates. As if further validation of factors that have been powering US stock prices was required, the Commerce Department reported just before month-end that its broadest measure of corporate measure of after-tax profits across the US rose 16.1% in the quarter ended June 30 from a year earlier. This was the largest year-over-year gain in six years. At the same time, the Commerce Department also revised upward US economic growth in the second quarter to an annual rate of 4.2% from an earlier estimate of 4.1%. Yet even as the outlook remains positive, the sharp stock run-up over the last two months has left some investors feeling cautious as we enter the month of September and what is considered a more volatile fall interval in global markets.
The Federal Reserve also fueled momentum, with news that it remains accommodative with its monetary policy. Interest rates are being lifted slowly and predictably while its balance sheet is being trimmed in a similarly deliberative fashion. In its release of the minutes from the July 31 to August 1 meeting, the Federal Reserve signaled that it is likely to raise interest rates in September, after raising its benchmark rate the second time this year in June to a range between 1.75% and 2%. Short-term rates ended August at 2.03% while 10-Year US Treasury securities closed the month at 2.86% or 10 basis points lower than the level at July 31. Against this backdrop, the Bloomberg Barclays US Aggregate Bond Index posted a 0.64% gain for the month. This was the benchmark’s best showing since May.
At the same time, the SUSTAIN Equity Fund Index gained 2.79% in August, lagging behind the S&P 500 by 47 basis points while the SUSTAIN Bond Fund Indicator recorded an increase of 0.66% in August, beating the Bloomberg Barclays U.S. Aggregate Bond Index and expanding the year-to-date outperformance by 0.24% or 24 basis points. The broadest universe of sustainable funds, a universe of 1,064 mutual funds and ETFs covering all asset classes from money markets to equities, posted a one-month average gain of 0.84%.
Model portfolios post results in August ranging from 1.28% to 2.49%
The Aggressive Sustainable Portfolio (95% stocks/5% bonds), Moderate Sustainable Portfolio (60% stocks/40% bonds) and the Conservative Sustainable Portfolio (20%/80%) generated positive results in August, ranging from 1.28% to 2.49%. Each of the portfolios, but in particular the Aggressive and Moderate portfolios with their heavier stock allocations, benefited from the outperformance recorded by the Vanguard FTSE Social Index Fund-Investor Shares that was up 3.77% for the month versus 3.26% for the S&P 500, for a 51 basis points advantage. Refer to Table 1. In the process, the spread between the portfolios and their corresponding benchmarks expanded to the widest levels since inception as of October 2012. These now extend from a low of 8.2% applicable to the Conservative Sustainable Portfolio to 14.6% applicable to the Moderate Sustainable Portfolio and to 20.1% applicable to the Aggressive Sustainable Portfolio. It should be noted that these portfolios have not been rebalanced since their inception dates. Refer to Chart 1.
Even as the Domini Impact International Equity-Investor Shares and TIAA-CREF Social Choice Bond-Retail Shares each slightly underperformed their designated non-sustainable indexes, the Conservative Sustainable, Moderate Sustainable and Aggressive Sustainable portfolios each exceeded the performance of their corresponding benchmarks.
Sustainable funds register an average gain of 0.84%, ranging from 22.48% to -9.76%
Within a universe of 1,064 sustainable funds with performance for the full month, including mutual funds, exchange-traded funds (ETFs) and exchange-traded notes (ETNs) and their corresponding share classes, returns for the month of August, hampered by the performance of non-US stocks, averaged 0.84% versus last month when sustainable funds, on average, posted a gain of 2.14%. A total of 745 funds, or 70%, posted 0.00 to positive results for the month.
The highest return at 22.48% was delivered by the iPath Global Carbon ETN, a $10.8 million exchange-traded note that provides exposure to the global price of carbon by referencing the price of carbon emissions credits from the world’s major emissions related mechanisms. This highly volatile ETN was up +17.2% last month and is up 178.13% year-to-date. The performance of the outlier iPath ETN was followed by the $3.7 million Riverbridge Eco Leaders Fund-Investor Shares that was up 8.2% with the benefit of its technology investments such as Amazon and Microsoft, to mention just two. At the other end of the range, the recently launched $6.4 million Amplify Advanced Battery Metals and Materials ETF, that in addition to various fundamental considerations takes into consideration a company’s environmental, social and governance (ESG) scores, posted a -9.67% decline on the back of weak metals and mining prices and increased volatility. Refer to Table 2.
Sustainable funds close August at $310.6 billion, with net inflows adding and estimated $2.05 billion, the second highest this year
The net assets of 1,066 sustainable funds, including mutual funds, ETFs and ETNs, ended the month of July at $310.6 billion versus $303.9 billion at the end of July. Of the $6.6 billion increase, an estimated $2.9 billion is attributable to market movement driven by economic growth momentum and a sturdy fundamental backdrop of strong corporate earnings, low unemployment and contained inflation, bolstered by an accommodative Federal Reserve which overcame a number of challenges to bolster stock results in the US. Refer to Chart 2.
Three fund firms, including two new entrants, repurposed 4 funds, for a total of 19 share classes, and in the process shifted a total of $1,180.5 million into the sustainable investing sphere. At the same time, the universe of sustainable funds experienced approximately $2.05 billion in net inflows, or 0.7%, the second highest level of inflows so far this year and second only to January’s $2.2 billion.
Mutual funds ended the month at $301.5 billion, comprised of 1,066 funds and share classes, accounting for about 97% of sustainable fund assets and unchanged from the previous month. ETFs and ETNs closed the month with $9.1 billion in assets across 78 ETFs.
Sustainableinvest.com
Benefits
Free access to regularly updated original research and analysis focused exclusively on sustainable finance and investing, providing investors with the guidance needed to make informed investment decisions that align with their personal values and financial goals while also contributing to the advancement of positive long-term environmental and social outcomes.
By offering financial support for our current work, either in the form of a one-time or regular contributions, you help to defray some of the costs associated with conducting our research and analysis as well as to maintain the www.sustainablest.wpengine.com website.
Helping us to expand our research capabilities and offerings over time to cover additional relevant topics geared to sustainable investors.
Sign up to free newsletters.
By submitting this form, you are consenting to receive marketing emails from: . You can revoke your consent to receive emails at any time by using the SafeUnsubscribe® link, found at the bottom of every email. Emails are serviced by Constant Contact