Market Wrap Up-August 2017
The S&P 500 eked out a narrow total return gain in August, rising 0.31% even as volatility picked up after a placid start to the year. The narrower based DJIA gained 0.65% while the Nasdaq Composite Index extended its record streak and ended up 1.43%. August proved to be an eventful month, as economic and financial developments combined with politics and geopolitical events to upend a stretch of much calmer trading over the preceding two months in particular. Near the end of the month, Hurricane Harvey led to widespread devastation across Texas that also impacted U.S. refining capacity in the region. Still, the performance of most major asset classes was broadly positive again in August. Bonds in the U.S. outperformed the S&P 500 Index for the first time this year, gaining 0.9% as investors sought shelter in gold and U.S. Treasuries which saw yields drop. Global bonds also performed well, registering an increase of 1.0% due to a broad-based contribution from almost all fixed income asset classes. [ihc-hide-content ihc_mb_type=”show” ihc_mb_who=”3,4,5″ ihc_mb_template=”4″ ]
Following two months of calm, the Dow Jones Industrial Average (DJIA) in the middle of August posted its biggest decline in three months, one week after a selloff of similar scale that sent stock indexes tumbling around the world. Factors contributing to investor uneasiness included the rising tensions between the U.S. and North Korea as the verbal battle escalated between Donald Trump and North Korea’s Kim Jong Un, Trump’s deteriorating relationship with U.S. business leaders in the wake of the Charlottesville, Virginia’s violent demonstrations and his divisive remarks on the protests which served to further increase political disarray within the current administration. Terror attacks in Spain could also have figured in the decline and more generally, concerns about lifting the debt ceiling by the end of September along with a loss of confidence that President Trump can accomplish his agenda of tax cuts and infrastructure investing to stimulate economic growth.
Still, stock prices recovered at the end of the month. The Conference Board reported that its index of consumer confidence rose to 122.9 in August from a revised 120 in July. The index in March reached 124.9, its highest level since December 2000. The index has been buoyed by labor-market strength and stock prices. Economic strength was another contributing factor. The Commerce Department reported that the U.S. economy had expanded at an annual rate of 3% in the second quarter of the year, better than initial estimates of 2.6% for the quarter and representing a substantial acceleration over the first quarter’s 1.2% pace. While Hurricane Harvey introduced some uncertainties, most economists are expecting the economy to expand at a rate of roughly 3% in the second half of the year—a pace strong enough to keep job growth and wages on track for further gains while keeping the threat of inflation modest for now.
In Europe, economic momentum improved, with the euro area posting second-quarter GDP growth of 2.2%–the highest level since 2011. The MSCI Europe ex-UK Index was penalized by the strong euro and closed with a negative return of -0.4%. Emerging markets delivered a return of 2.1% thanks to a weak dollar and positive fundamentals in China.
Sustainable Portfolios Performance Summary
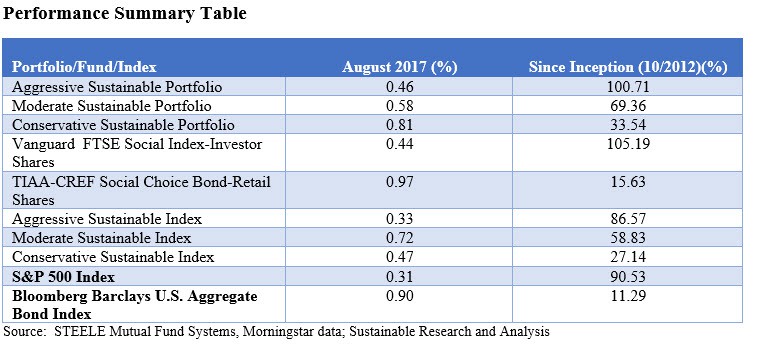
Positive rates of return were generated by each of the sustainable portfolios, led by the Conservative Sustainable Portfolio (80% bonds/20% stocks) that benefited from the 0.97% gain produced by TIAA-CREF Social Choice Bond Fund-Retail on the back of the strong U.S. bond market performance that registered a gain of 0.90%. The S&P 500 Index trailed the U.S. bond market with a slight total return gain of 0.31% that was exceeded by the 0.44% increase delivered by the Vanguard FTSE Social Index Investor Shares. The Moderate Sustainable Portfolio (60% stocks/40% bonds) and the Aggressive Sustainable Portfolio (95% stocks/5% bonds) produced gains of 0.58% and 0.46%, respectively. Each of the sustainable portfolios outperformed their designated indexes.
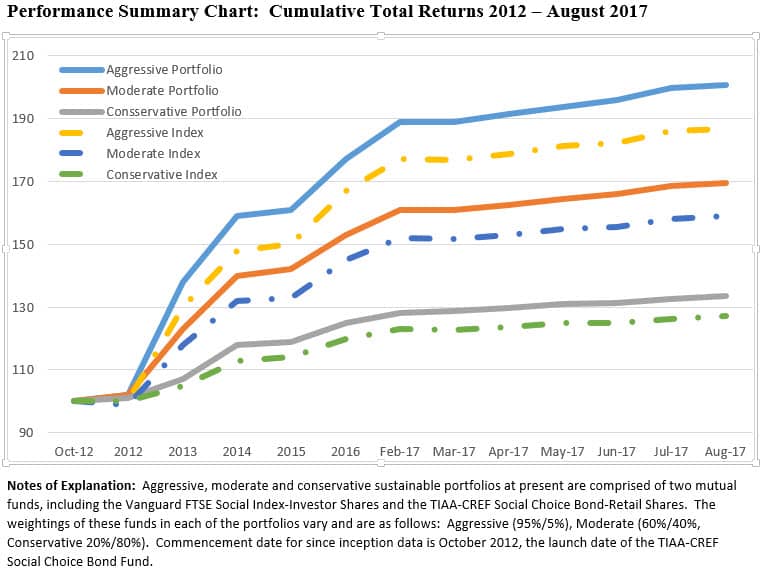
On a cumulative basis since October 2012, the three portfolios, Aggressive, Moderate and Conservative, are up 100.71%, 69.4% and 33.5%, respectively, comfortably in excess of their corresponding indexes that are up 86.6%, 58.8% and 27.1%.


Monthly Sustainable Fund Flows
The net assets of sustainable funds, including mutual funds, ETFs and ETNs, remained unchanged during the month of August. Net assets ended the month again at $216.6 versus a prior month-over-month increase of 3%. The same can be said for the mutual funds versus ETF and ETN component. These ended the month at $210.5 billion and $6.0 billion respectively.
At the end of August, fixed income funds combined, including taxable, tax-exempt and money market funds, held about $18.3 billion in net assets as compared to $17.9 while all other funds, consisting largely of equity funds, stood at $198.3 billion. Actively managed funds account for $202.3 billion or 93.4% of sustainable assets under management across mutual funds, ETFs and ETNs.
[/ihc-hide-content]
Sustainable Portfolios Performance Summary: August 2017
Market Wrap Up-August 2017
Share This Article:
Market Wrap Up-August 2017
The S&P 500 eked out a narrow total return gain in August, rising 0.31% even as volatility picked up after a placid start to the year. The narrower based DJIA gained 0.65% while the Nasdaq Composite Index extended its record streak and ended up 1.43%. August proved to be an eventful month, as economic and financial developments combined with politics and geopolitical events to upend a stretch of much calmer trading over the preceding two months in particular. Near the end of the month, Hurricane Harvey led to widespread devastation across Texas that also impacted U.S. refining capacity in the region. Still, the performance of most major asset classes was broadly positive again in August. Bonds in the U.S. outperformed the S&P 500 Index for the first time this year, gaining 0.9% as investors sought shelter in gold and U.S. Treasuries which saw yields drop. Global bonds also performed well, registering an increase of 1.0% due to a broad-based contribution from almost all fixed income asset classes. [ihc-hide-content ihc_mb_type=”show” ihc_mb_who=”3,4,5″ ihc_mb_template=”4″ ]
Following two months of calm, the Dow Jones Industrial Average (DJIA) in the middle of August posted its biggest decline in three months, one week after a selloff of similar scale that sent stock indexes tumbling around the world. Factors contributing to investor uneasiness included the rising tensions between the U.S. and North Korea as the verbal battle escalated between Donald Trump and North Korea’s Kim Jong Un, Trump’s deteriorating relationship with U.S. business leaders in the wake of the Charlottesville, Virginia’s violent demonstrations and his divisive remarks on the protests which served to further increase political disarray within the current administration. Terror attacks in Spain could also have figured in the decline and more generally, concerns about lifting the debt ceiling by the end of September along with a loss of confidence that President Trump can accomplish his agenda of tax cuts and infrastructure investing to stimulate economic growth.
Still, stock prices recovered at the end of the month. The Conference Board reported that its index of consumer confidence rose to 122.9 in August from a revised 120 in July. The index in March reached 124.9, its highest level since December 2000. The index has been buoyed by labor-market strength and stock prices. Economic strength was another contributing factor. The Commerce Department reported that the U.S. economy had expanded at an annual rate of 3% in the second quarter of the year, better than initial estimates of 2.6% for the quarter and representing a substantial acceleration over the first quarter’s 1.2% pace. While Hurricane Harvey introduced some uncertainties, most economists are expecting the economy to expand at a rate of roughly 3% in the second half of the year—a pace strong enough to keep job growth and wages on track for further gains while keeping the threat of inflation modest for now.
In Europe, economic momentum improved, with the euro area posting second-quarter GDP growth of 2.2%–the highest level since 2011. The MSCI Europe ex-UK Index was penalized by the strong euro and closed with a negative return of -0.4%. Emerging markets delivered a return of 2.1% thanks to a weak dollar and positive fundamentals in China.
Sustainable Portfolios Performance Summary
Positive rates of return were generated by each of the sustainable portfolios, led by the Conservative Sustainable Portfolio (80% bonds/20% stocks) that benefited from the 0.97% gain produced by TIAA-CREF Social Choice Bond Fund-Retail on the back of the strong U.S. bond market performance that registered a gain of 0.90%. The S&P 500 Index trailed the U.S. bond market with a slight total return gain of 0.31% that was exceeded by the 0.44% increase delivered by the Vanguard FTSE Social Index Investor Shares. The Moderate Sustainable Portfolio (60% stocks/40% bonds) and the Aggressive Sustainable Portfolio (95% stocks/5% bonds) produced gains of 0.58% and 0.46%, respectively. Each of the sustainable portfolios outperformed their designated indexes.
On a cumulative basis since October 2012, the three portfolios, Aggressive, Moderate and Conservative, are up 100.71%, 69.4% and 33.5%, respectively, comfortably in excess of their corresponding indexes that are up 86.6%, 58.8% and 27.1%.
Monthly Sustainable Fund Flows
The net assets of sustainable funds, including mutual funds, ETFs and ETNs, remained unchanged during the month of August. Net assets ended the month again at $216.6 versus a prior month-over-month increase of 3%. The same can be said for the mutual funds versus ETF and ETN component. These ended the month at $210.5 billion and $6.0 billion respectively.
At the end of August, fixed income funds combined, including taxable, tax-exempt and money market funds, held about $18.3 billion in net assets as compared to $17.9 while all other funds, consisting largely of equity funds, stood at $198.3 billion. Actively managed funds account for $202.3 billion or 93.4% of sustainable assets under management across mutual funds, ETFs and ETNs.
[/ihc-hide-content]
Sustainableinvest.com
Benefits
Free access to regularly updated original research and analysis focused exclusively on sustainable finance and investing, providing investors with the guidance needed to make informed investment decisions that align with their personal values and financial goals while also contributing to the advancement of positive long-term environmental and social outcomes.
By offering financial support for our current work, either in the form of a one-time or regular contributions, you help to defray some of the costs associated with conducting our research and analysis as well as to maintain the www.sustainablest.wpengine.com website.
Helping us to expand our research capabilities and offerings over time to cover additional relevant topics geared to sustainable investors.
Sign up to free newsletters.
By submitting this form, you are consenting to receive marketing emails from: . You can revoke your consent to receive emails at any time by using the SafeUnsubscribe® link, found at the bottom of every email. Emails are serviced by Constant Contact