Portfolio’s Performance Summary
- February Results: S&P 500 up 3.21% while the Sustainable Large Cap Equity Funds Index gains 3.77%.
- Model portfolios: Gains recorded in February, on top of the strong increases in January, erased in their entirety the declines posted in December of last year.
- Universe of sustainable mutual funds and ETFs across all fund types gain an average 2.52%.
- Sustainable funds achieved another new all-time high at the end of February, reaching $485.4 billion in net assets versus $440.2 billion in January with net cash inflows contributing $1.67 billion or 2.8%.
[ihc-hide-content ihc_mb_type=”show” ihc_mb_who=”3,4,5″ ihc_mb_template=”4″ ]
February Results: S&P 500 up 3.21% while the Sustainable Large Cap Equity Funds Index gains 3.77%
After posting a gain of 8.01% in January, the best monthly results since October 2015, the S&P 500 Index recorded another consecutive increase in February. The index added 3.21% and extended its year-to-date gain to 11%, thus erasing and exceeding December’s 9.2% decline. The NASDAQ Composite Index and the Dow Jones Industrial Average delivered even better results, posting gains of 3.60% and 4.03%, respectively. Fitting in within this range, sustainable large cap funds, as measured by the SUSTAIN Equity Fund Index, gained 3.77%. Growth stocks outperformed value stocks while small company stocks excelled, adding 5.2% for the month. Except for Latin America, most stock markets ended the month in the black, with total return results falling in the 2%-3% range while China registered a gain of 3.45%. Investment-grade intermediate bonds, as measured by the Bloomberg Barclays US Aggregate Index, gave up -0.06% as yields on 10-Year Treasuries rose 10 basis points (bps) from January 31st to end the month at 2.73%. Still, investor sentiment remains cautious with some positing that the 2019 rally is unjustified. The best two-month start to the year since 1987 was fueled by a more patient Federal Reserve Bank, better than expected corporate earnings and a lowering of US-China trade tensions that was confirmed before month-end when it was announced that the US was abandoning, for now, its threat to raise tariffs on $200 billion of Chinese goods that would have gone into effect on March 1.
ESG Model portfolios: Gains recorded in February, on top of the strong increases in January, erased in their entirety the declines posted in December of last year
The gains recorded in February, on top of the strong increases in January, erased in their entirety the declines posted in December of last year. Positive total return performance results ranging from 0.13% to 3.29% that were delivered by each of the three underlying mutual funds that comprise the model portfolios contributed to this outcome. At the same time, excess index returns generated by the TIAA CREF Social Choice Bond Retail Shares and Vanguard FTSE Social Index Investor Shares were offset by the total return posted by the Domini Impact International Equity Investor Shares. The fund trailed its conventional benchmark by 1.1%. As a result, the Aggressive Sustainable Portfolio (95% stocks/5% bonds) and Moderate Sustainable Portfolio (60% stocks/40% bonds) lagged their corresponding indexes by 21 basis points (bps) and six bps for the month. On the other hand, the Conservative Sustainable Portfolio (20% stocks/80% bonds) with a limited exposure to foreign stocks, beat its corresponding conventional benchmark by 11 basis points. Refer to Table 1.
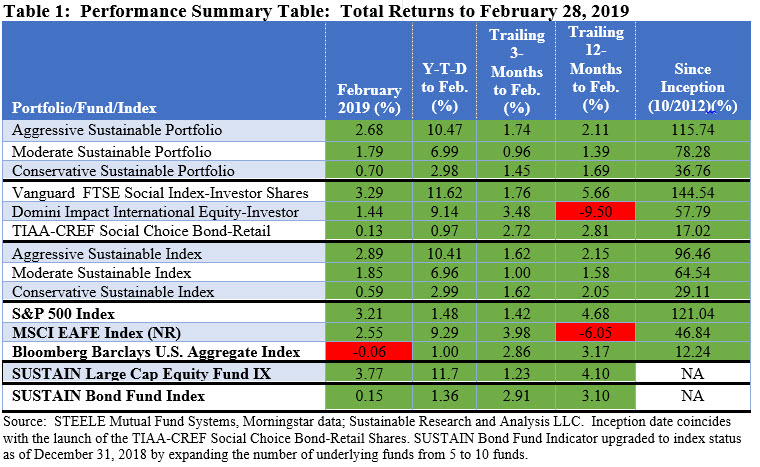
The reverse is true for performance results delivered since the start of the year. The Aggressive and Moderate Sustainable portfolios outperformed their conventional indexes by 0.3% and 0.6%, respectively, while the Conservative Sustainable Portfolio fell behind by a mere one basis point.
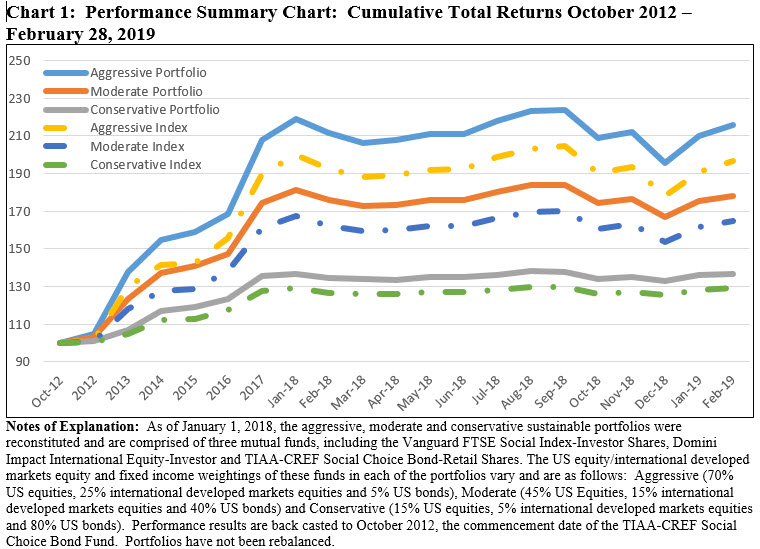
While lagging their corresponding conventional benchmarks for the trailing twelve-month interval, each of the model portfolios continues to outpace their benchmarks since their inception as of October 2012 by a significant range, from almost 7% to 19%. Refer to Chart 1.
The universe of sustainable mutual funds and ETFs across all fund types gain an average 2.52%
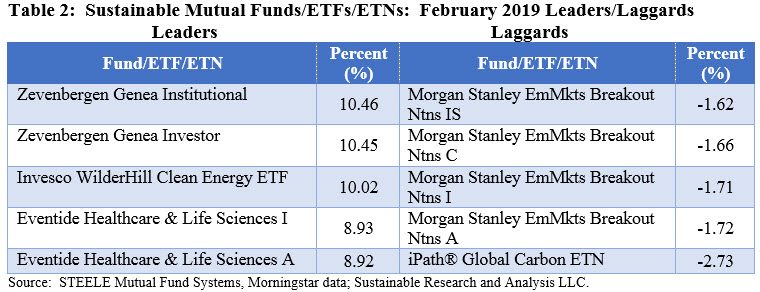
Sustainable funds across all fund types, a total of 1,440 mutual funds, ETFs and ETNs with performance results for the entire month of February, posted an average total return gain of 2.52%. Results ranged from a high of 10.46% recorded by the Zevenbergen Genea Institutional Fund, to a low of -2.73% generated by the iPath Global Carbon ETN. The Zevenbergen Genea Fund invests in innovative transformational businesses at an emerging stage, oftentimes near the company’s initial public offering, that are also evaluated on the basis of ESG risks. iPath is a highly volatile thematic exchange-traded note (ETN) that provides exposure to the global price of carbon by referencing the price of carbon emissions credits from the world’s major emissions related mechanisms. Equity and all equity related funds added an average of 3.02% in February and 11.47% on a year-to-date basis while fixed income funds, including taxable and municipal investment vehicles. gained an average of 0.54% and 2.37% since the start of the year. Refer to Table 2.
Sustainable funds achieved another new all-time high at the end of February, reaching $485.4 billion in net assets versus $440.2 billion in January with net cash inflows contributing $1.67 billion or 2.8%
Sustainable funds again registered another monthly all-time high of $485.4 billion in assets as of February 28, 2019, with the net addition of $45.3 billion for the month versus $49.8 billion added in January 2019. Of this sum, $1.7 billion is attributable to net positive inflows, but additions of $31.1 billion due to repurposed or rebranded funds and $12.5 billion attributable to market movement had a more significant impact on the growth of sustainable assets. Refer to Chart 2.
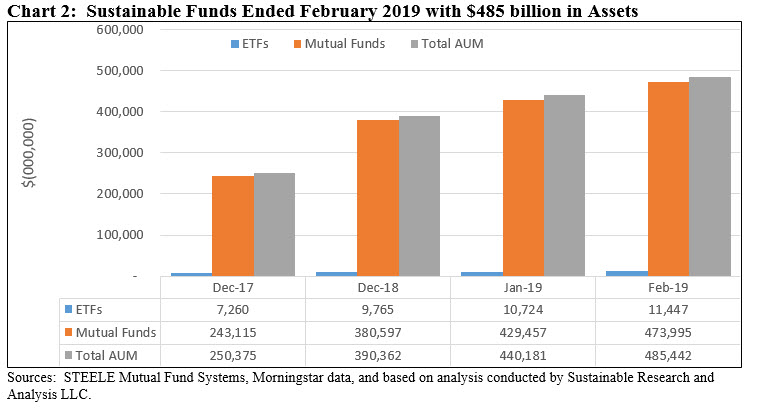
Mutual funds, which account for 97.6% of the segment’s assets under management (AUM), were responsible for 98.4% of the month-over-month gains. The assets were distributed across 1,320 mutual funds/share classes and 129 ETFs/ETNs offered by 127 separate firms. Eight separate fund groups, including four first time firms, either repurposed existing funds for the first time or added to the roster of existing funds by repurposing additional funds and share classes, for a total of 30 funds and 124 share classes. The largest of these was Mainstay that repurposed two funds, with 14 share classes, and total net assets in the amount of $11.7 billion. The other three firms include Sterling Capital Management (subsidiary of BB&T), Mass Mutual and Front Street Capital Management, Inc. (Clark Fork Trust) that on a combined basis added about $3.3 billion.
In a relatively new development for the sustainable funds segment, two sustainable funds are in the process of closing. The $11.8 million Highmore Sustainable All Cap Equity Fund, which was launched in early 2018, closed in February 2019 while the $1.8 million Spouting Rock Small Cap Growth Fund, which commenced operations in 2014, announced that it was intending to close as of March 20, 2019.
[/ihc-hide-content]


