Summary
This was a challenging and turbulent year for stocks and bonds. The S&P 500 Index ended 2018 down -4.38% and -9.03% in December. Intermediate-term investment-grade bonds eked out a slight 0.01% gain for the year after posting a strong 1.84% gain in December. At the same time, benchmarks tracking domestic equity and investment-grade bonds that pursue similar sustainable investing strategies, the SUSTAIN Large Cap Equity Fund Index and the SUSTAIN Bond Fund Indicator, both lagged their corresponding conventional indexes by almost 1% and .06%, respectively.
[ihc-hide-content ihc_mb_type=”show” ihc_mb_who=”3,4,5″ ihc_mb_template=”4″ ]
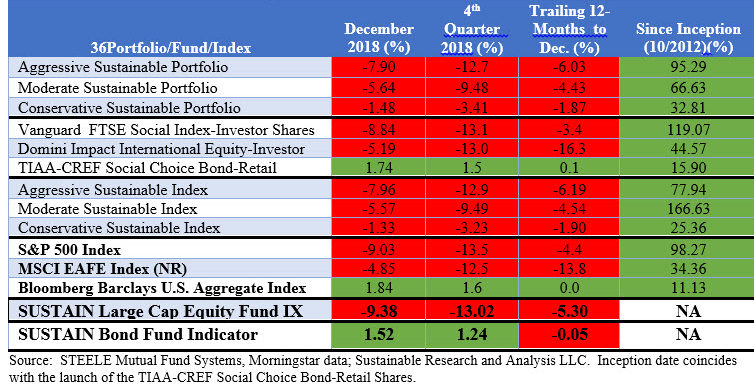
Model portfolios were buffeted by the turbulent markets in December and their performance was defined by levels of exposure to equities versus bonds. Aggressive, Moderate and Conservative Sustainable Portfolios registered negative results in December ranging from a low of -1.48% to -7.90%, based on the portfolio’s risk profile. The aggressive and moderate portfolios posted their steepest declines so far this year, giving up -7.90% and -5.64%, respectively, while the conservative portfolio beat the -2.73% decline recorded in October with a still negative -1.48% decline.
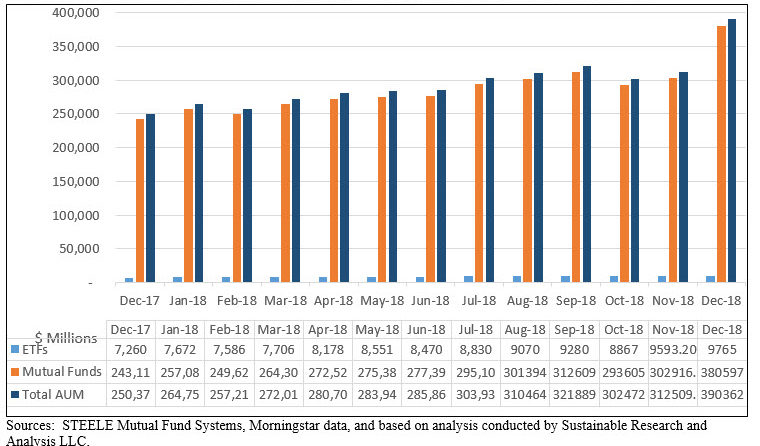
Sustainable funds closed December at an all-time high with $390.4 billion.
2018: A challenging and turbulent year
In what turned out to be a very challenging and turbulent year, the S&P 500 Index posted its worst performance since 2008. The broad-based index ended 2018 down -4.38% versus -37% in 2008 and compared to a gain of 21.83% in the prior year 2017. In the month of December, the S&P 500 gave up -9.03% and this pushed the fourth quarter results down to -13.52%. European, Asian and China’s markets performed even worse. The MSCI Europe and Asia indexes were down -14.86% and -18.88%, respectively. On the other hand, investment-grade bonds, which were in negative territory all year long, gained 1.84% in December and this lifted the Bloomberg Barclays US Aggregate Index up to 1.64% for the quarter and to an increase of 0.01% for the full year. Benchmarks tracking domestic equity and investment-grade bonds that pursue similar sustainable investing strategies, the SUSTAIN Large Cap Equity Fund Index and the SUSTAIN Bond Fund Indicator, both lagged their corresponding conventional indexes by almost 1% and .06%, respectively.
Model portfolios buffeted by turbulent markets in December and their performance was defined by levels of exposure to equities versus bonds
Reversing course this month, the Aggressive Sustainable Portfolio (95% stocks/5% bonds), Moderate Sustainable Portfolio (60% stocks/40% bonds) and the Conservative Sustainable Portfolio (20%/80%) registered negative results in December ranging from a low of -1.48% to -7.90%, based on the portfolio’s risk profile. The aggressive and moderate portfolios posted their steepest declines so far this year, giving up -7.90% and -5.64%, respectively, while the conservative portfolio beat the -2.73% decline recorded in October with a still negative -1.48% decline. The conservative portfolio benefited from the positive performance posted by investment-grade intermediate bonds during a month when this market segment diverged from the results posted by equities in the US and overseas. At the same time, it was one of two portfolios to fall behind their corresponding conventional index as both the TIAA-CREF Social Choice Bond-Retail Shares and Domini Impact International Equity-Investor Shares underperformed their corresponding conventional indexes. Refer to Table 1.
Performance Summary Table: Total Returns to December 31, 2018

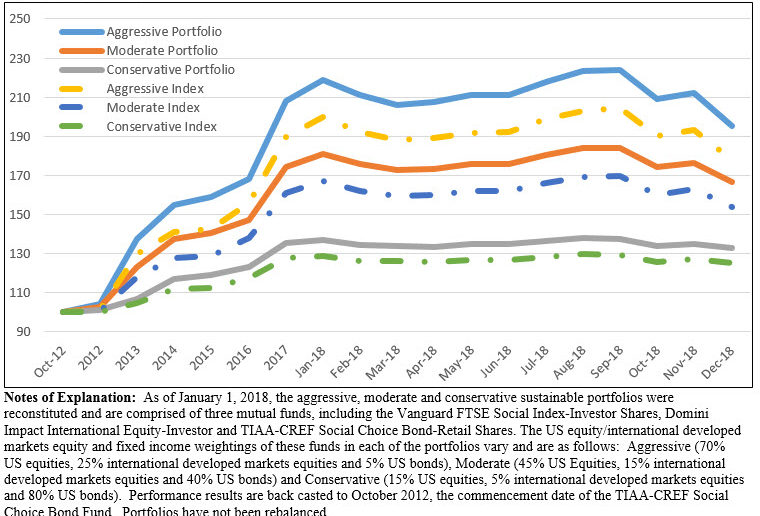
While each of the three model portfolios ended 2018 on a negative note, they still all managed to outperform their conventional benchmarks by small margins ranging from 0.02% to 0.16%. The model portfolios also continue to outperform their corresponding indexes since their inception in October 2012. Refer to Chart 1.
The performance of the underlying funds in December ranged from a positive 1.74% registered by TIAA-CREF Social Choice Bond-Retail Shares to -5.19% recorded by the Domini Impact International Equity-Investor Shares, to the –8.84% return for the Vanguard FTSE Social Index-Investor Shares. Only Vanguard managed to outperform its corresponding conventional index, the S&P 500, in December. The same fund along with TIAA-CREF Social Choice Bond-Retail Shares also exceeded the performance of their conventional benchmarks over the 1-year period, with the Vanguard FTSE Social Index-Investor Shares eclipsing the performance of the S&P 500 by a full 1.0% with only a slightly higher level of monthly volatility.
Performance Summary Chart: Cumulative Total Returns October 2012-December 31, 2018

The model portfolios will be rebalanced as of December 31, 2018 to bring these back into alignment with their corresponding risk-based allocation ratios and also to take advantage of new investment options launched to year that can potentially improve returns and reduce risks.
Sustainable mutual funds and ETFs posted an average return of -7.80% and -5.69% for the year, respectively
Across the range of funds in operation throughout the entire month, a total of 1,271 funds, including mutual funds, exchange traded funds (ETFs) and exchange traded notes (ETNs), extending from money market funds to fixed income funds and to domestic and international funds, designated sustainable funds registered an average return of -5.84% in December. A total of 187 funds or 15% of funds recording results ≥0.00%. These outcomes ranged from a high of 21.16% generated by the small iPath Carbon ETN, which was followed by several long-dated investment-grade intermediate bond funds, to a low of -13.85% recorded by Parnassus Endeavor Investor Shares. See Table 2.
Sustainable Mutual Funds ETFs/ETNs: December 2018 Leader/Laggards

The best performing iPath Carbon ETN is a highly volatile $12.6 million exchange-traded note (its 3-year monthly standard deviation is 18.12 versus, for example, 3.26 for the iShares MSCI KLD 400 Social ETF) that provides exposure to the global price of carbon by referencing the price of carbon emissions credits from the world’s major emissions related mechanisms. At the other end of the range, the lowest return was posted by Parnassus Endeavor Fund Investor Shares, a $3.7 billion fund that invests in large capitalization stocks “with low turnover and high conviction in approximately 30 holdings.” The fund “invests in companies that represent Parnassus’ clearest expression of ESG investing: portfolio companies must offer outstanding workplaces, and must not be engaged in the extraction, exploration, production, manufacturing, or refining of fossil fuels. This workplace focus can result in significant exposure to technology companies, many of which are leaders in offering positive and innovative workplaces.” Parnassus recognized that the market was overvalued and its strategy had been to avoid highflyers. Even as this was intended to manage downside risks, the fund was hit hard due to its heavy weighting in technology that was partially offset by avoiding the poorest performing energy sector. Beyond that, some of the fund’s positions suffered declines in some of its heavily weighted stocks ranging from 29% to 18% during the month of December.
Average total return results across the same range of funds in operation throughout the entire quarter and calendar year 2018 were -10.37% and -7.68%, respectively. For more detailed December 2018 performance results, refer to December 2018 Sustainable Investment Funds Performance Results.
Sustainable funds closed December at an all-time high with $390.4 billion
Sustainable funds reached an all-time high of $390.4 billion in assets as of December 31, 2018 with the net addition of $75.3 billion in December. Refer to Chart 2. The entire increase is attributable to fund re-brandings, or repurposing of existing funds, which added a total of $99.5 billion while market movement and net cash outflows during the volatile month depressed the value of sustainable assets by $20.7 billion and $3.5 billion, respectively. Also contributing to positive flows in December were eight new fund launches form American Century, Deutsche Asset Management, Eventide, Gotham and Natixis Funds that together contributed $280.2 million in new assets.

Twenty funds consisting of 135 funds/share classes sourced to six investment management firms repurposed existing funds with total net assets of $99.5 billion. The largest of these, in terms of asset shifts, were sourced to two firms, JP Morgan and Washington Mutual. JP Morgan adopted an ESG integration approach for its funds while the American Funds American Mutual Fund implemented a negative screening policy that precludes the fund from investing in companies deriving the majority of their revenues from alcohol or tobacco products. On a combined basis, these two firms shifted a total of 14 funds with combined assets of $87.9 billion in assets.
For the year as a whole, the increase of $141.5 billion from $250 billion at December 31, 2017 is attributable to three factors, including market movement, fund re-brandings and net cash flows. By far, the largest contributor to the increase is attributable to the rebranding of existing funds, which added $155.9 billion, net cash inflows that netted an estimated $13 billion in assets while market movement depressed the value of assets by an estimated $27.4 billion.
Sustainable (SUSTAIN) Large Cap Equity Fund Index Explained
The index, which was initiated as of June 30, 2017 with data back to December 31, 2016, tracks the total return performance of the ten largest actively managed large-cap domestic equity mutual funds that employ a sustainable investing strategy beyond absolute reliance on exclusionary practices for religious, ethical or social reasons. While methodologies vary, to qualify for inclusion in the index, funds in excess of $50 million in net assets must actively apply environmental, social and governance (ESG) criteria to their investment processes and decision making. In tandem with their ESG integration strategy, funds may also employ exclusionary strategies along with impact-oriented investment approaches as well as shareholder advocacy.
Multiple funds managed by the same management firm may be included in the index, however, a fund with multiple share classes is only included in the index once, based on the largest share class in terms of assets. The index is equally weighted, it is calculated monthly and rebalanced once a year as of December 31.
The combined assets associated with the ten funds stood at $21.2 billion and represent about 13.7% of the entire sustainable US equity sector that is comprised of 220 funds/share classes, including actively managed funds and index funds, with $154.4 billion in assets under management.
Sustainable (SUSTAIN) Bond Fund Indicator Explained
This benchmark, which was initiated as of December 31, 2017, tracks the total return performance of the five largest actively managed investment-grade intermediate-term bond mutual funds that employ a sustainable investing strategy beyond absolute reliance on exclusionary practices for religious, ethical or social reasons. While methodologies vary, to qualify for inclusion in the benchmark, funds in excess of $50 million in net assets must actively apply environmental, social and governance (ESG) criteria to their investment processes and decision making. In tandem with their ESG integration strategy, funds may also employ exclusionary strategies, impact-oriented investment approaches as well as issue-oriented advocacy.
Multiple funds managed by the same management firm may be included in the benchmark, however, a fund with multiple share classes is only included once, based on the largest share class in terms of assets. The indicator is equally weighted, it is calculated monthly and rebalanced once a year as of December 31.
At the time it was constructed as of December 31, 2017 less than 10 funds qualified under the criteria set forth above and for this reason to distinguish this measure from a more robust one in terms of number of constituent funds, the benchmark is referred to as an indicator rather than an index. The combined assets associated with the five funds stood at $2.7 billion and these funds account for 15.3% of the entire sustainable US taxable fixed income sector that is comprised of 109 funds/share classes, including actively managed funds and index funds for a total of $17.8 billion in assets under management.
[/ihc-hide-content]


