Summary
A volatile August ended the last week of the month as it began but with opposite outcomes, driven by trade tensions between the US and China, geopolitical uncertainties and signs of an economic slowdown in the US and overseas. In the end, the broad market as measured by the S&P 500 Index closed down -1.58%. Bonds, on the other hand, benefited from lower yields and delivered a blowout month, up 2.59%, based on the Bloomberg Barclays US Aggregate Index. Sustainable mutual funds/share classes, ETFs and ETNs, a total of 2,262 funds across all types from equity to fixed income, generated an average total return of -1.42%. Leading and lagging funds ranged from a high of +11.17% to a low of -13.12%.
Equity Funds and Other Equity and Equity-Related Funds
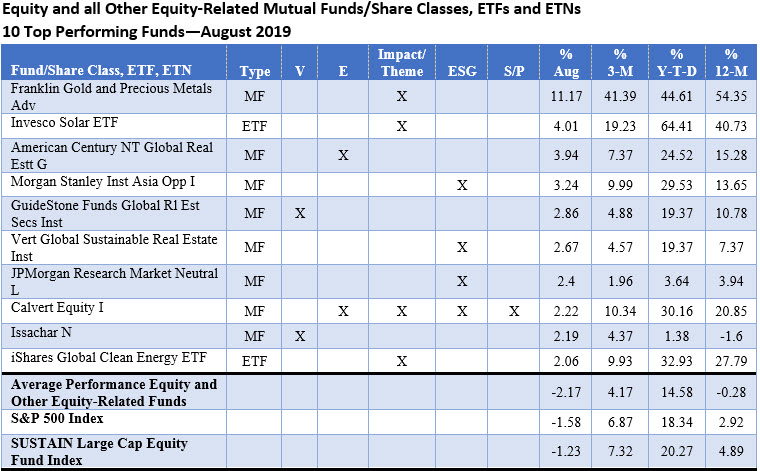
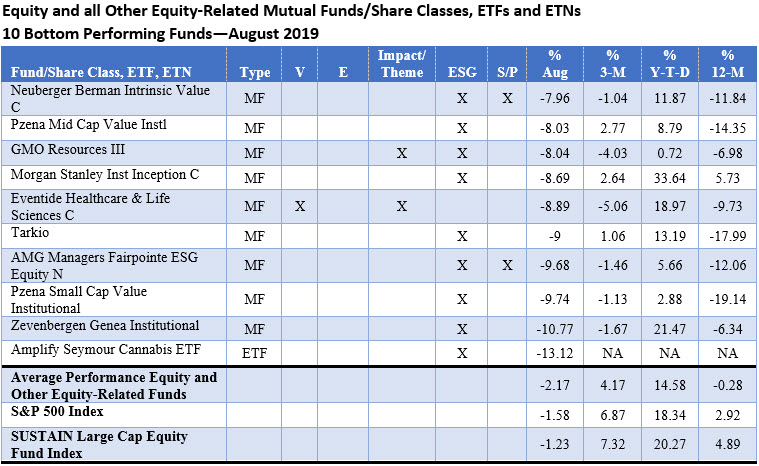
During a month when bonds outperformed US stocks, equity and equity related sustainable funds, including mutual funds/share classes, exchange-traded funds (ETFs) and exchange-traded notes (ETNs) posted a negative average total return in August of -2.17%. Total returns ranged from a high of 11.17% recorded by Franklin Gold and Precious Metals Fund-Adv. to a low of -13.12% registered by the Amplify Seymour Cannabis ETF. Both funds employ ESG integration approaches.
[ihc-hide-content ihc_mb_type=”show” ihc_mb_who=”3,4,5″ ihc_mb_template=”4″ ]
In addition to precious metals, leading funds included alternative energy and global real estate funds whereas at the other end of the spectrum, lagging funds, in addition to Amplify Seymour Cannabis ETF, include a varied mix of small cap and mid-cap funds to thematic funds concentrating in health and life sciences and natural resources.
Fixed Income Funds
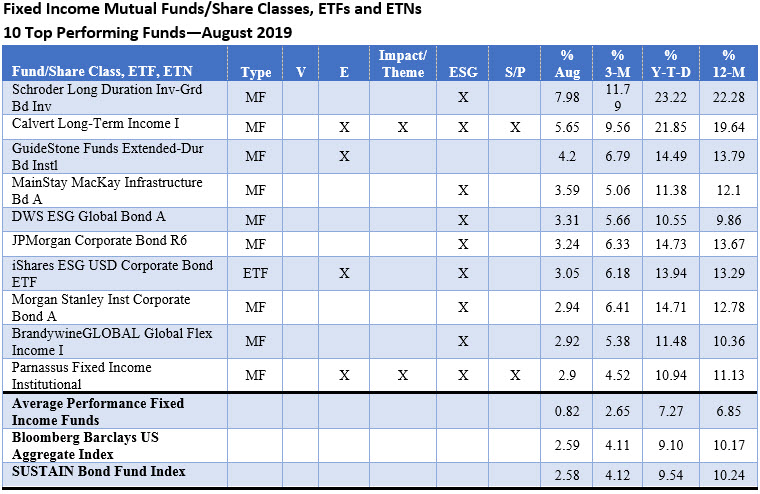
Bonds and bond funds had a strong month as interest rates declined across the entire maturity curve (excepting 1-month Treasury bills), with 10-year Treasury yields giving up 56 basis points (bps) to end the month at 1.50% and 30-year Treasury yields giving up 57 bps to end August at 1.96%. Sustainable bond funds produced an average return of 0.82% and an average year-to-date gain of 7.27%. The SUSTAIN Bond Fund Index posted a gain of 2.58%.
Longer dated bond funds recorded the best results. The Schroders Long Duration Investment-Grade Bond Fund Inv. and Calvert Long-Term Income I gained 7.98% and 5.65%, respectively. Global bond funds and emerging market bond funds ended August with results at the other end of the range. The worst performing funds were four Franklin Templeton emerging market and global funds with returns ranging from -6.69% to -4.31%.
Sustainable Investing Strategies
The leading and lagging sustainable funds universe in August was again dominated by funds that have adopted an ESG integration approach, either exclusively or in combination with other sustainable strategies. This segment consists of 32 funds/share classes and ETFs our of 40 funds/share classes in total, including 22 that rely on ESG integration exclusively while the other 10 funds/share classes and ETFs combine ESG integration with one or more other sustainable strategies, such as negative screening (exclusions).
That said, the leading and lagging performers varied based in their sustainability profiles. Leading equity and other related funds were split four each between funds adopting ESG integration exclusively or in combination with other strategies and funds that fall into the Impact/Thematic category. Om the other hand, lagging sustainable fixed income funds consist entirely of funds that have adopted ESG integration approaches, including two funds that also employ negative screening (exclusion) and bondholder engagement.
August Performance Scorecards


Notes of Explanation covering equity and other equity-related funds: Results are total returns. For funds that have rebranded (by adopting via a prospectus amendment a sustainable investing strategy) during the last 12-months, returns for periods longer than one-month may not reflect results achieved pursuant to the newly adopted sustainable investing strategies. Equity funds include all US and international equity as well as all other funds, except for fixed income funds, a total of 1,692 funds/share classes, ETFs, ETNs with performance for the full month of August 2019. Blanks for other time periods indicate that the fund was not in operations during the entire time interval. Top 10 defined as top 10 funds, excluding multiple share classes of the same fund (i.e. if more than one share class landed in the top of bottom listing of the 10 funds only the best performing one fund/share class is included. V=Values-based strategy, E=Exclusionary strategy, Impact/Theme=Impact and/or thematic strategy, ESG=environmental, social, governance integration, S/P=shareholder/bondholder engagement and proxy voting. Sources: STEELE Mutual Fund Expert, Morningstar data and Sustainable Research and Analysis.
Notes of Explanation covering fixed income funds: Results are total returns. For funds that have rebranded (by adopting via a prospectus amendment a sustainable investing strategy) during the last 12-months, returns for periods longer than one-month may not reflect results achieved pursuant to the newly adopted sustainable investing strategies. Fixed income funds include short and long-term taxable and tax-exempt bond funds and ETFs, a total of 569 funds/share classes, ETFs, ETNs with performance for the full month of August 2019. Blanks for other time periods indicate that the fund was not in operations during the entire time interval. Top 10 defined as top 10 funds, excluding multiple share classes of the same fund (i.e. if more than one share class landed in the top of bottom listing of the 10 funds only the best performing one fund/share class is included. V=Values-based strategy, E=Exclusionary strategy, Impact/Theme=Impact and/or thematic strategy, ESG=environmental, social, governance integration, S/P=shareholder/bondholder engagement and proxy voting. Sources: STEELE Mutual Fund Expert, Morningstar data and Sustainable Research and Analysis.[/ihc-hide-content]


