The Bottom Line: Fund’s net assets declined in January, also recording positive relative performance, while new fund launches lagged and sustainable bonds gain in 2023.
|
Long-Term Net Assets: Sustainable Mutual Funds and ETFs
|
|
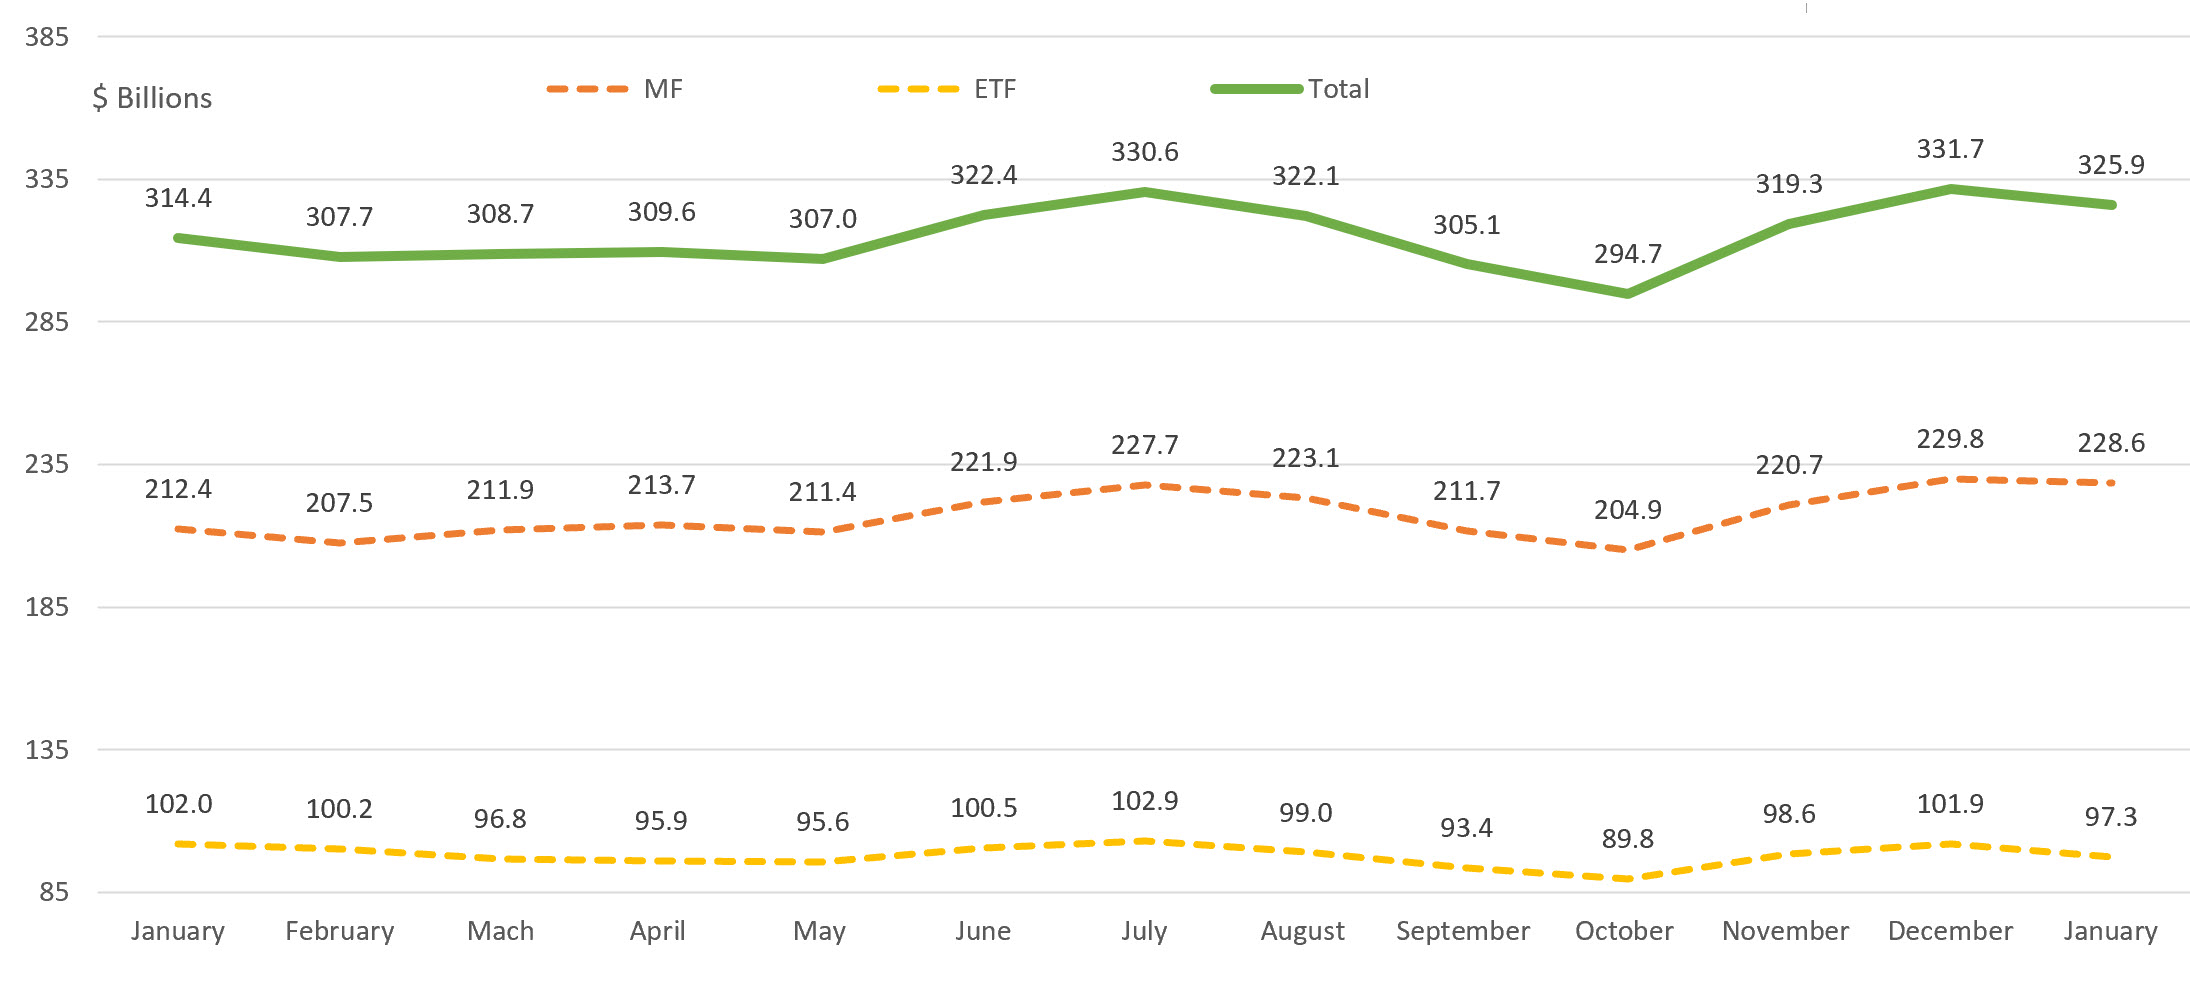
Long-terms sustainable fund assets under management attributable to mutual funds and ETFs, 1,551 funds/share classes in total based on Morningstar classifications, closed the month of January with $325.9 billion in net assets, dropping $5.8 billion, or 1.8% of assts versus December 2023. This represented a setback relative to the monthly average gain in assets of $1.7 billion over the previous twelve months. Sustainable mutual fund assets recorded a net decline in January, ending the month at $228.6 billion, for a net reduction of $1.2 billion, or 0.5%. On the other hand, assets sustainable to ETFs dropped by $4.6 billion or a decline of 4.6%. Based on a simple calculation, it is estimated that sustainable funds experienced net cash inflows in January, sourced to mutual funds. Mutual funds likely saw estimated net outflows in the amount of $400,000 while ETFs experienced and estimated $1.6 billion in outflows. The divergence between net asset changes affecting mutual funds and ETFs is attributable to some significant variations in the composition of funds that make up each segment and the performance of some of these segments in January. For example, the sustainable ETF segment includes 16 funds/share classes, making up 7% of ETF assets classified in the Miscellaneous category that dropped 11.4% in January. The same category in the mutual funds segment is comprised of only 7 funds/share classes, makes up about 0% of mutual fund assets and recorded a decline of 7.9%. |
|
New Sustainable Fund Launches |
|
One new ETF was launched in January but there were no new mutual fund listings. By way of comparison, there were two ETF listings and 14 mutual fund launches in January of last year. Mutual fund and ETF listings started to decelerate following the launch of 29 funds in May of 2023. During January, there were also five sustainable fund closings, including one mutual fund and four ETFs. The five funds likely closed due to their inability to attract assets. Four of the five funds had less than $10 million in AUM while the fifth fund was likely unable to reach scale beyond its seed capital. |
|
Green, Social and Sustainability Bonds Issuance |
|
According to data provided by SIFMA, global green, social and sustainable bond issuance in the fourth quarter of 2023 reached $128.9 billion, for a Q/Q $19.5 billion decline or 10.6%. 4Q US issuance, which declined for the second quarter in a row, dropped to $27 billion, down $1.3 billion or -4.4%. Global 2023 issuance reached $745.9 billion, for a Y/Y gain of $33.3 billion or 4.7%. Notwithstanding the deceleration in the US in the second half of 2023, total US issuance in 2023 rose to $122.0 billion, up from $93.8 billion in 2022 or a 30 Y/Y increase. US green, social and sustainability bonds issuance accounted for 1.5% of total US fixed income issuance in 2023. It should be noted that SIFMA’s sustainable bonds issuance trends exclude certain types of sustainable bonds, such as sustainability-linked bonds and notes. According to data published by another source, for example Bank of America, total global sustainable bond issuance in 2023 reached $828 billion, for a Y/Y 7% gain. Of this sum, green bonds account for 59% of the total, or $489 billion, up 12% Y/Y. Some other data sources have arrived at even higher numbers for global issuances. |
|
Short-Term Relative Performance: Selected ESG Indices vs. Conventional Indices |
|
Performance results posted in the first month of the year were mixed. While not as rigorous, the S&P 500 Index registered its third consecutive monthly gain in January, rising 1.7%, as stocks responded to stronger than expected economic reports without upward pressure on inflation. These data points were complemented by strength in corporate earnings and sales. Outside the US, emerging markets slumped 4.64% likely due to concerns regarding the economic outlook for China, pushing the MSCI ACWI, ex USA Index lower by almost 1%. At the same time, US investment-grade intermediate bonds gave up 0.27% for the month as expectations for the number and timing of interest rate cuts were tempered toward the end of the month based on the Federal Reserve Banks hawkish tone at its January meeting. Global government bonds were down 1.8%. Against this backdrop, a selection of six US and international equity ESG Leaders indices and one fixed income benchmark calculated by MSCI either matched or outperformed their conventional counterparts. This is in sharp contrast to December’s relative performance when only one of six indices outperformed their conventional counterparts. That said, performance results are mixed over the intermediate-term, including the trailing three and five year time intervals. |
Notes of Explanation: Revised and updated 2-19-2024. Sources: Morningstar Direct, SIFMA, and Sustainable Research and Analysis.


![Monitor-1-istockphoto-1437090010-612×612-3[1] Monitor-1-istockphoto-1437090010-612x612-3[1]](https://sustainablest.wpengine.com/wp-content/uploads/elementor/thumbs/Monitor-1-istockphoto-1437090010-612x612-31-2-r9s7e2aed1qqg9yi2cpd239lst9qqb7mxo8vlrrwks.jpg)


