U.S. stock indices posted a series of record highs during November and closed the next to last month of the year with their strongest monthly gains since June.
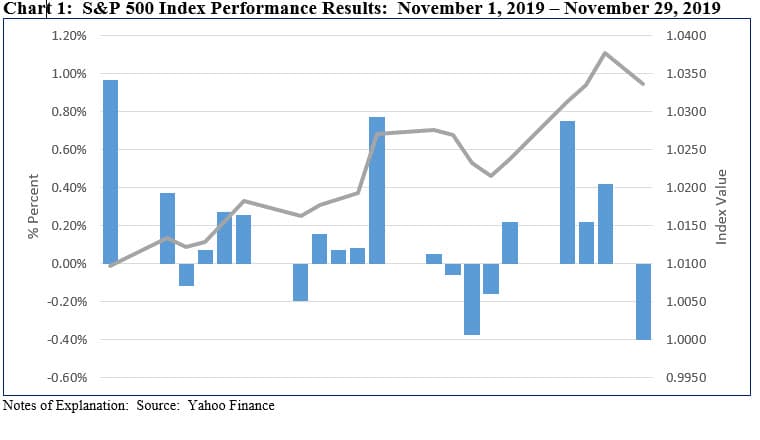
U.S. stock indices posted a series of record highs during November and closed the next to last month of the year with their strongest monthly gains since June. The Dow Jones Industrial Average, S&P 500 and the Nasdaq Composite each experienced a steady march upward and rose more than 3% for the month as investors reacted favorably to positive US economic news ahead of the Thanksgiving holiday while continuing to shrug off geopolitical and domestic political uncertainties, including US-China trade, Brexit, unrest in Hong-Kong and impeachment proceedings in the US. Refer to Chart 1. The S&P 500 Index gained 3.63%, the Dow Jones Industrial Average closed even higher at 4.11% while the NASDAQ Composite added 4.64%. In June the S&P 500 shot up 7.05%. Small stocks performed well, expanding by 4.12% per the Russell 2000 Index, and continuing to outpace the S&P 500 for the third month in a row. Small cap growth stocks recorded even stronger gains, returning 5.89%, however, this relationship did not hold for large cap stocks. Across sectors, Healthcare, Information Technology and Financials led with returns of 8.24%, 6.39% and 5.14%, respectively, while Utilities, Real Estate and Energy were the only sectors to post negative results, giving up -2.05%, -1.96% and -0.70%, in that order.
Stocks in the US eclipsed their counterparts overseas
Stocks in the US eclipsed their counterparts overseas. The MSCI ACWI ex US gained 2.44% while emerging markets backtracked with regional variations. Latin America dropped -4.13% while Asian emerging markets added 0.53%, boosted by China which was up 1.78%.
US rates rose across the yield curve
US rates rose across the yield curve. Three-month Treasuries ticked up 5 basis points, 2-year Treasuries added 9 basis points to end November at 1.61% while 10-year treasuries also gained 9 basis points to end at 1.78%. Intermediate investment-grade bonds, on the other hand, closed the month -0.05% lower on a total return basis while US Treasuries declined -0.3%.
Before month-end, the Commerce Department reported that the US economy expanded in the third quarter at a slightly better pace than initially estimated, even as business investment continued to drag. Real gross domestic product (GDP) increased at an annual rate of 2.1% in the third quarter of 2019, according to the “second” estimate released by the Bureau of Economic Analysis on the basis of more complete sources of data. This compares to a 2% real GDP increase in the second quarter and reflected an upward revision of the previously issued advance estimate of GDP which was 1.9% mainly due to upward revisions to private inventory investment, nonresidential fixed investment, and personal consumption expenditures (PCE) that were partially offset by a downward revision to state and local government spending.
Economic resilience and earnings growth
The resiliency in growth might be attributed to easing from the Federal Reserve (Fed). Housing data has improved markedly, with new housing permits reaching their highest level since 2007, while mortgage delinquency rates reached their lowest level since 1995. Despite the Fed’s interest rate cuts, consumer confidence was weaker than expected. In comments to Congress, Fed chair Jerome Powell said that “the current stance of monetary policy is likely to remain appropriate.” Consequently, the market was now expecting only one more interest rate cut from the Fed in 2020.
Earnings season came to a close, with S&P 500 companies reporting broadly flat earnings relative to the third quarter of last year. As in previous quarters this year, the materials and energy sectors delivered the weakest numbers, with meaningful contractions in earnings. Overall, around 80% of companies beat earnings estimates for the quarter, however, earnings expectations had been lowered throughout the year.
Sustainable (SUSTAIN) Large Cap Equity Fund Index ended the month marginally lower than S&P 500, trailing by just 0.003%
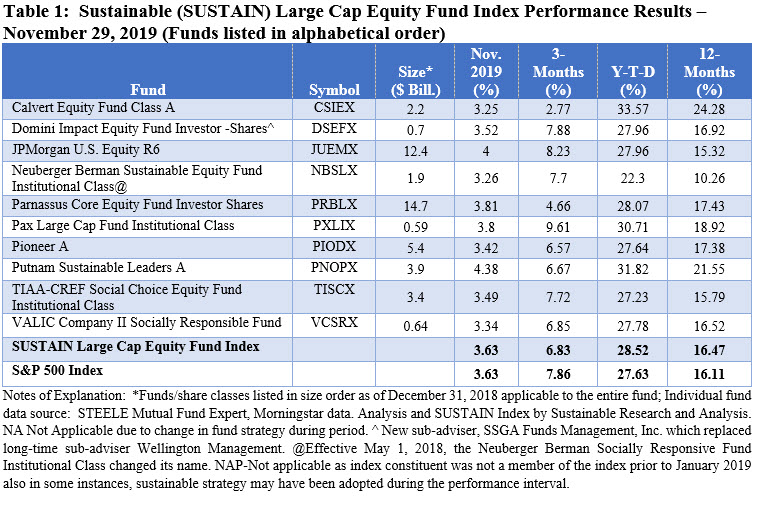
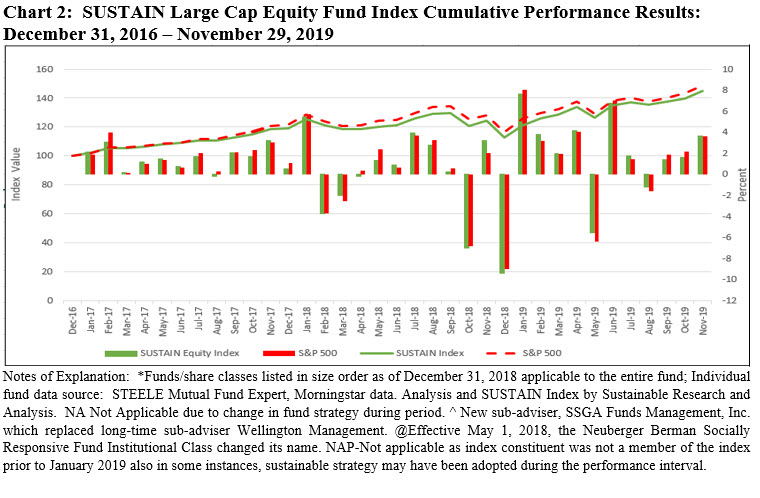
Four of the ten constituent funds beat the S&P 500 in November, posting returns ranging from 3.8% to a high of 4.38% recorded by the Putnam Sustainable Leaders Fund A. This was enough to deliver a 3.627% return for the SUSTAIN Large Cap Equity Fund Index which was just a shade 0.003% short of the S&P 500. While the margin was quite narrow, it was still the third consecutive month of underperformance for sustainable large cap equity funds. It leaves the SUSTAIN Index behind the S&P 500 by 1.03% and 3.7% for the trailing three months and since inception as of December 31, 2016, respectively. Refer to Table 1 and Chart 2.
The $4.6 billion large cap growth-oriented Putnam Sustainable Leaders Fund, that led in November, was 80.9% invested in US equities while non-US equities accounted for 17.37% of total net assets as of October 31. The foreign component likely was not additive to performance in November, however, the fund should have benefited from its 31.29% exposure to the technology sector and 13.13% commitment to financial services. Further, the fund’s avoidance of investments in two of the three worst performing sectors in November, namely the energy and utilities sectors, also boosted the fund’s performance as did over-weightings in top portfolio holdings such as Microsoft Corp., Apple Inc. and Visa Inc. that gained between 3.1% and 7.4% in November. The fund is also the second best performer on a year-to-date and trailing 12-months basis. During these intervals the fund has also outpaced the S&P 500. The large cap blend $15.5 billion JPMorgan US Equity R6 also performed well, benefiting from its limited 2.8% commitment to non-US stocks. The fund added 4% in November and leads the S&P 500 over the trailing three months and year-to-date intervals.
At the other end of the range and bringing up the rear for the second consecutive month is the large cap growth-oriented Calvert Equity Fund A which gained 3.25% versus last month’s -0.19% and the previous month’s -2.77% decline. The fund’s shift to an underweight position in technology was a drag on recent performance and the fund lagged the S&P 500 during the previous three months while still maintaining its lead position since the start of the year and the trailing 12-months.
Sustainable (SUSTAIN) Bond Fund Index trails its conventional index by 7 basis points
Only for the second time this year intermediate investment-grade bonds ended the month in the red, giving up -0.05% in November. The SUSTAIN Bond Fund Index trailed by 7 basis points after matching the Bloomberg Barclays US Aggregate Index in October but lagging during the previous two months. This left the SUSTAIN Bond Fund Index behind for the last three as well as twelve month intervals but in the lead on a year-to-date basis due to its outperformance in January and February of the year. Refer to Table 2 (revised 12/27/2019) and Chart 3.
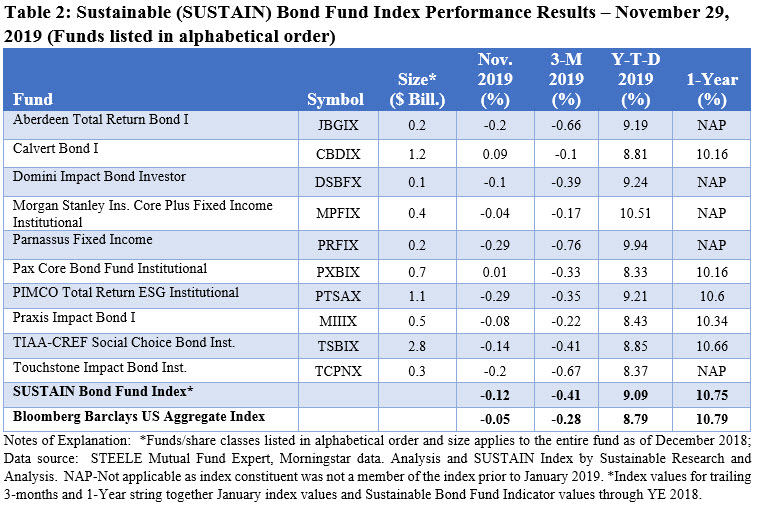
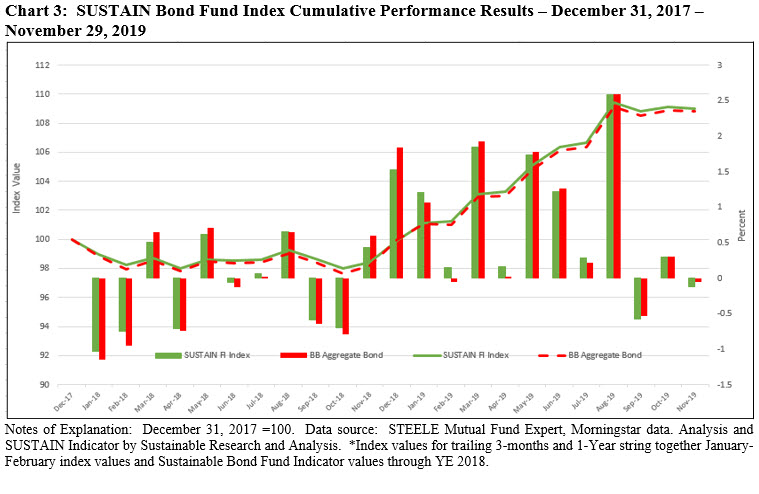
Only five of the ten index members outperformed in November, and the two leading funds were the only ones to register positive total returns. Calvert Bond I was the top performing fund, adding 0.09%, likely benefiting from its lower effective duration of 4.95 and higher than index allocation of 37.31% to corporates, including industrials, financial institutions and utilities. The second ranked Pax Core Bond Fund Institutional shares added 0.01%.
The $1.4 billion PIMCO Total Return ESG Fund Institutional brought up the rear in November, giving up -0.29%.
Sustainable (SUSTAIN) Foreign Equity Fund Index continues to beat the MSCI ACWI ex US, outperforming by 47 basis points in November
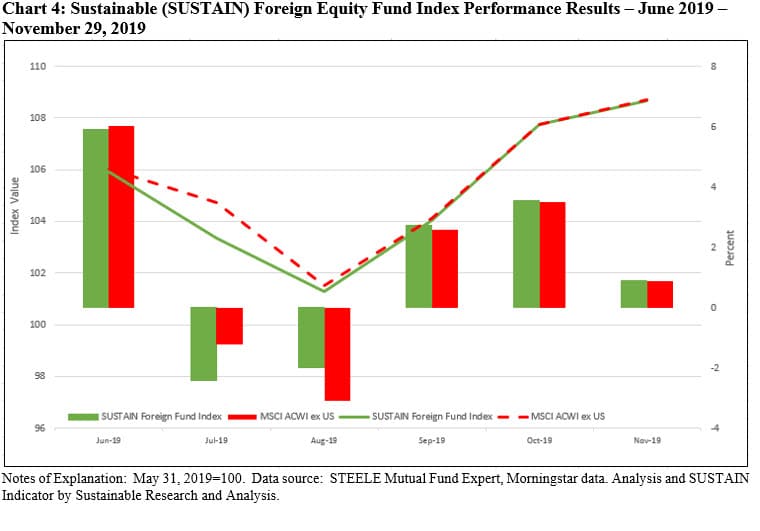
The SUSTAIN Foreign Equity Fund Index continues for the fourth month in a row to outperform the MSCI ACWI ex USA (NR) Index. Posting a 1.35% return in November, the SUSTAIN Foreign Equity Fund Index led the conventional benchmark by 47 basis points as eight of ten funds that comprise the index outperformed the conventional benchmark. That again places the SUSTAIN Index ahead over the trailing three months. Refer to Table 3 and Chart 4.
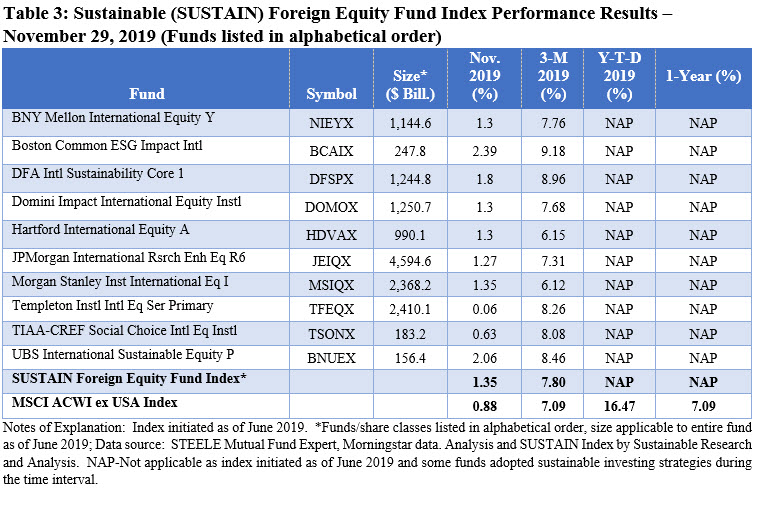
The two top performing funds in November switched rankings relative to October. The Boston Common ESG Impact International Fund led in November, posting a return of 2.39% versus its second place result of 4.23% in October. The large cap growth fund benefited from the outperformance of growth stocks versus value, especially in European developed markets where the fund maintained a level of relative overexposure. The fund also ranks highest over the trailing three months with its return of 9.18%. At the same time, the large blend-oriented UBS International Sustainable Equity Fund P, that delivered a 4.41% total return in October, posted a 2.06% return in November.
Bringing up the rear, the large cap value-oriented Templeton Institutional International Equity Series Fund Primary lost its momentum in November, generating a return of 0.06% as value oriented foreign stocks decelerated following September’s outperformance.
Sustainable Indices Post Mixed Results in November 2019
U.S. stock indices posted a series of record highs during November and closed the next to last month of the year with their strongest monthly gains since June. U.S. stock indices posted a series of record highs during November and closed the next to last month of the year with their strongest monthly gains since…
Share This Article:
U.S. stock indices posted a series of record highs during November and closed the next to last month of the year with their strongest monthly gains since June.
U.S. stock indices posted a series of record highs during November and closed the next to last month of the year with their strongest monthly gains since June. The Dow Jones Industrial Average, S&P 500 and the Nasdaq Composite each experienced a steady march upward and rose more than 3% for the month as investors reacted favorably to positive US economic news ahead of the Thanksgiving holiday while continuing to shrug off geopolitical and domestic political uncertainties, including US-China trade, Brexit, unrest in Hong-Kong and impeachment proceedings in the US. Refer to Chart 1. The S&P 500 Index gained 3.63%, the Dow Jones Industrial Average closed even higher at 4.11% while the NASDAQ Composite added 4.64%. In June the S&P 500 shot up 7.05%. Small stocks performed well, expanding by 4.12% per the Russell 2000 Index, and continuing to outpace the S&P 500 for the third month in a row. Small cap growth stocks recorded even stronger gains, returning 5.89%, however, this relationship did not hold for large cap stocks. Across sectors, Healthcare, Information Technology and Financials led with returns of 8.24%, 6.39% and 5.14%, respectively, while Utilities, Real Estate and Energy were the only sectors to post negative results, giving up -2.05%, -1.96% and -0.70%, in that order.
Stocks in the US eclipsed their counterparts overseas
Stocks in the US eclipsed their counterparts overseas. The MSCI ACWI ex US gained 2.44% while emerging markets backtracked with regional variations. Latin America dropped -4.13% while Asian emerging markets added 0.53%, boosted by China which was up 1.78%.
US rates rose across the yield curve
US rates rose across the yield curve. Three-month Treasuries ticked up 5 basis points, 2-year Treasuries added 9 basis points to end November at 1.61% while 10-year treasuries also gained 9 basis points to end at 1.78%. Intermediate investment-grade bonds, on the other hand, closed the month -0.05% lower on a total return basis while US Treasuries declined -0.3%.
Before month-end, the Commerce Department reported that the US economy expanded in the third quarter at a slightly better pace than initially estimated, even as business investment continued to drag. Real gross domestic product (GDP) increased at an annual rate of 2.1% in the third quarter of 2019, according to the “second” estimate released by the Bureau of Economic Analysis on the basis of more complete sources of data. This compares to a 2% real GDP increase in the second quarter and reflected an upward revision of the previously issued advance estimate of GDP which was 1.9% mainly due to upward revisions to private inventory investment, nonresidential fixed investment, and personal consumption expenditures (PCE) that were partially offset by a downward revision to state and local government spending.
Economic resilience and earnings growth
The resiliency in growth might be attributed to easing from the Federal Reserve (Fed). Housing data has improved markedly, with new housing permits reaching their highest level since 2007, while mortgage delinquency rates reached their lowest level since 1995. Despite the Fed’s interest rate cuts, consumer confidence was weaker than expected. In comments to Congress, Fed chair Jerome Powell said that “the current stance of monetary policy is likely to remain appropriate.” Consequently, the market was now expecting only one more interest rate cut from the Fed in 2020.
Earnings season came to a close, with S&P 500 companies reporting broadly flat earnings relative to the third quarter of last year. As in previous quarters this year, the materials and energy sectors delivered the weakest numbers, with meaningful contractions in earnings. Overall, around 80% of companies beat earnings estimates for the quarter, however, earnings expectations had been lowered throughout the year.
Sustainable (SUSTAIN) Large Cap Equity Fund Index ended the month marginally lower than S&P 500, trailing by just 0.003%
Four of the ten constituent funds beat the S&P 500 in November, posting returns ranging from 3.8% to a high of 4.38% recorded by the Putnam Sustainable Leaders Fund A. This was enough to deliver a 3.627% return for the SUSTAIN Large Cap Equity Fund Index which was just a shade 0.003% short of the S&P 500. While the margin was quite narrow, it was still the third consecutive month of underperformance for sustainable large cap equity funds. It leaves the SUSTAIN Index behind the S&P 500 by 1.03% and 3.7% for the trailing three months and since inception as of December 31, 2016, respectively. Refer to Table 1 and Chart 2.
The $4.6 billion large cap growth-oriented Putnam Sustainable Leaders Fund, that led in November, was 80.9% invested in US equities while non-US equities accounted for 17.37% of total net assets as of October 31. The foreign component likely was not additive to performance in November, however, the fund should have benefited from its 31.29% exposure to the technology sector and 13.13% commitment to financial services. Further, the fund’s avoidance of investments in two of the three worst performing sectors in November, namely the energy and utilities sectors, also boosted the fund’s performance as did over-weightings in top portfolio holdings such as Microsoft Corp., Apple Inc. and Visa Inc. that gained between 3.1% and 7.4% in November. The fund is also the second best performer on a year-to-date and trailing 12-months basis. During these intervals the fund has also outpaced the S&P 500. The large cap blend $15.5 billion JPMorgan US Equity R6 also performed well, benefiting from its limited 2.8% commitment to non-US stocks. The fund added 4% in November and leads the S&P 500 over the trailing three months and year-to-date intervals.
At the other end of the range and bringing up the rear for the second consecutive month is the large cap growth-oriented Calvert Equity Fund A which gained 3.25% versus last month’s -0.19% and the previous month’s -2.77% decline. The fund’s shift to an underweight position in technology was a drag on recent performance and the fund lagged the S&P 500 during the previous three months while still maintaining its lead position since the start of the year and the trailing 12-months.
Sustainable (SUSTAIN) Bond Fund Index trails its conventional index by 7 basis points
Only for the second time this year intermediate investment-grade bonds ended the month in the red, giving up -0.05% in November. The SUSTAIN Bond Fund Index trailed by 7 basis points after matching the Bloomberg Barclays US Aggregate Index in October but lagging during the previous two months. This left the SUSTAIN Bond Fund Index behind for the last three as well as twelve month intervals but in the lead on a year-to-date basis due to its outperformance in January and February of the year. Refer to Table 2 (revised 12/27/2019) and Chart 3.
Only five of the ten index members outperformed in November, and the two leading funds were the only ones to register positive total returns. Calvert Bond I was the top performing fund, adding 0.09%, likely benefiting from its lower effective duration of 4.95 and higher than index allocation of 37.31% to corporates, including industrials, financial institutions and utilities. The second ranked Pax Core Bond Fund Institutional shares added 0.01%.
The $1.4 billion PIMCO Total Return ESG Fund Institutional brought up the rear in November, giving up -0.29%.
Sustainable (SUSTAIN) Foreign Equity Fund Index continues to beat the MSCI ACWI ex US, outperforming by 47 basis points in November


The SUSTAIN Foreign Equity Fund Index continues for the fourth month in a row to outperform the MSCI ACWI ex USA (NR) Index. Posting a 1.35% return in November, the SUSTAIN Foreign Equity Fund Index led the conventional benchmark by 47 basis points as eight of ten funds that comprise the index outperformed the conventional benchmark. That again places the SUSTAIN Index ahead over the trailing three months. Refer to Table 3 and Chart 4.
The two top performing funds in November switched rankings relative to October. The Boston Common ESG Impact International Fund led in November, posting a return of 2.39% versus its second place result of 4.23% in October. The large cap growth fund benefited from the outperformance of growth stocks versus value, especially in European developed markets where the fund maintained a level of relative overexposure. The fund also ranks highest over the trailing three months with its return of 9.18%. At the same time, the large blend-oriented UBS International Sustainable Equity Fund P, that delivered a 4.41% total return in October, posted a 2.06% return in November.
Bringing up the rear, the large cap value-oriented Templeton Institutional International Equity Series Fund Primary lost its momentum in November, generating a return of 0.06% as value oriented foreign stocks decelerated following September’s outperformance.
Sustainableinvest.com
Benefits
Free access to regularly updated original research and analysis focused exclusively on sustainable finance and investing, providing investors with the guidance needed to make informed investment decisions that align with their personal values and financial goals while also contributing to the advancement of positive long-term environmental and social outcomes.
By offering financial support for our current work, either in the form of a one-time or regular contributions, you help to defray some of the costs associated with conducting our research and analysis as well as to maintain the www.sustainablest.wpengine.com website.
Helping us to expand our research capabilities and offerings over time to cover additional relevant topics geared to sustainable investors.
Sign up to free newsletters.
By submitting this form, you are consenting to receive marketing emails from: . You can revoke your consent to receive emails at any time by using the SafeUnsubscribe® link, found at the bottom of every email. Emails are serviced by Constant Contact