The Bottom Line: Top and bottom performing mutual funds and ETFs in three categories are dominated by 34 funds that employ an ESG Integration strategy.
June markets summary
Ignoring the ravages of the COVID-19 pandemic that are still unfolding and focusing instead on the gradual progress made to contain and reverse the coronavirus pandemic, the barrage of fiscal and monetary stimulus programs and progress toward a breakthrough vaccine, the S&P 500 closed the month of June up 1.99% and registered a gain of 20.54% for the quarter. Outside the US, the MSCI All Country World, ex USA Index posted an increase of 4.5% in June and 16.1% in the quarter. Investment-grade intermediate bonds were up 0.6% in June and 6.1% year-to-date while high quality 20+ year government bonds were up 21.6% since the start of the year. Corporate credits led with a 1.8% gain in June but lagged behind Treasuries year-to-date at 4.8%.
ESG performance indicators
The universe of sustainable mutual funds and ETFs[1] across all asset classes and fund types, a total of 4,493 funds/share classes, gained an average 2.52% in June. Total returns ranged from a high of 27.59% recorded by the iPath Global Carbon ETN that provides exposure to the global price of carbon by referencing the price of carbon emissions credits from the world’s major emissions related mechanisms to a low of -6.21% posted by the AlphaCentric Energy Income Fund C, a thematic fund focusing on the infrastructure necessary to help drive the energy transition.
At the same time, the S&P 500 ESG Index added 2.45% in June and 20.57% in the quarter. This compares to lower gains for the conventional S&P 500 Index as well as the Sustainable (SUSTAIN) Large Cap Equity Fund Index. As for bonds, the Bloomberg Barclays MSCI US ESG Aggregate Focus Index recorded a gain of 0.59% in June and 2.82% in Q2 while its non-ESG counterpart performed slightly better, adding 0.62% in June and 2.92% in the second quarter. By way of comparison, the Sustainable (SUSTAIN) Bond Fund Index recorded beats in June and Q2. Completing the picture is the MSCI ACWI ex USA ESG Leaders Index which gained 5.0%, outperforming its conventional counterpart by 8 bps and the Sustainable (SUSTAIN) Foreign Equity Fund Index by 27 bps.
Top 10/bottom 10 performing funds
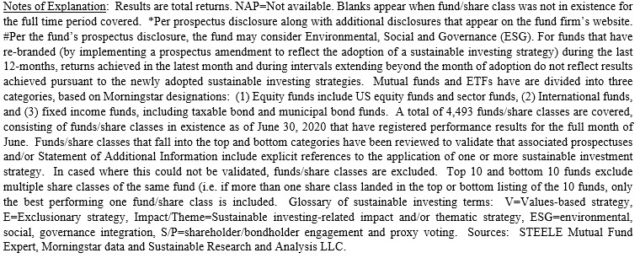
The 60 top and bottom performing funds in three investment categories, including US equity and sector funds, international equity and fixed income funds, both taxable and municipal, were dominated by 34 funds, or 57%, that employ an ESG Integration strategy. The rest, 9 funds or 15% follow an ESG Integration-Consideration approach and 2 funds pursue an ESG Integration-Mixed Approach. There were also four thematic funds and one fund pursues a values-based strategy.
For definitions, ESG Integration funds explicitly integrate ESG and may also engage with stakeholders. ESG Integration-Consideration covers funds that may integrate ESG while ESG Integration-Mixed refers to funds whose core strategy consists of ESG integration, but exclusions, impact or thematic approaches may also be employed.
Top/bottom US equity and sector equity funds-average performance 2.29%
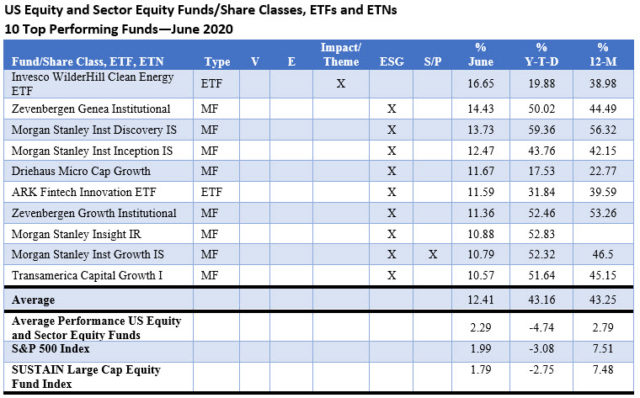
Sustainable US equity and sector equity funds posted an average gain of 2.19% in June, but the top 10 performing funds, all but one employing an ESG Integration approach, outperformed by a factor of almost 6X with an average increase of 12.41%. The 10 fund performing funds are dominated by large and small cap growth funds. Invesco Wilderhill Clean Energy ETF, the best performer, is the exception. Registering a gain of 16.65%, the thematic fund is composed of stocks of publicly traded companies in the United States that are engaged in the business of the advancement of cleaner energy and conservation.
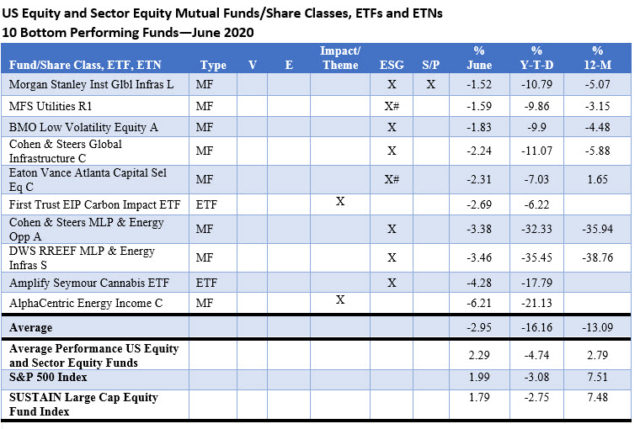
At the other end of the range, the 10 bottom performing funds produced an average -2.95% decline. Results ranged from -1.52% recorded by Morgan Stanley Institutional Global Infrastructure Fund L, a fund that by prospectus language integrates ESG, including engagement, to a negative -6.21% registered by Alphacentric Energy Income Fund C, a thematic fund that invests in equity and debt securities of domestic and foreign (including emerging markets) midstream energy infrastructure companies, renewable energy infrastructure companies and other issuers in the energy sector.
Top/bottom international equity funds-average performance 4.96%
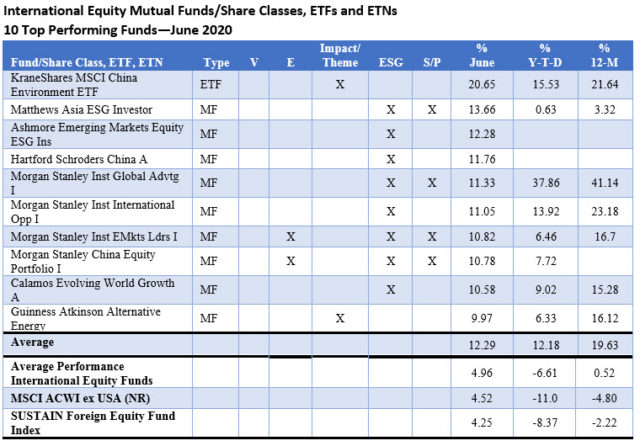
The average performance of international equity funds was eclipsed by the 12.29% average performance of the 10 best performing funds in the category as funds with a China mandate, in particular, posted returns as low as 9.97% and as high as 20.65%. The top 10 funds include six offerings that employ an ESG integration approach and two that also combine exclusions along with ESG Integration, or ESG Integration-Mixed. The remaining funds, including KraneShares MSCI China Environment ETF and Guinness Atkinson Alternative Energy, pursue a thematic investment style.
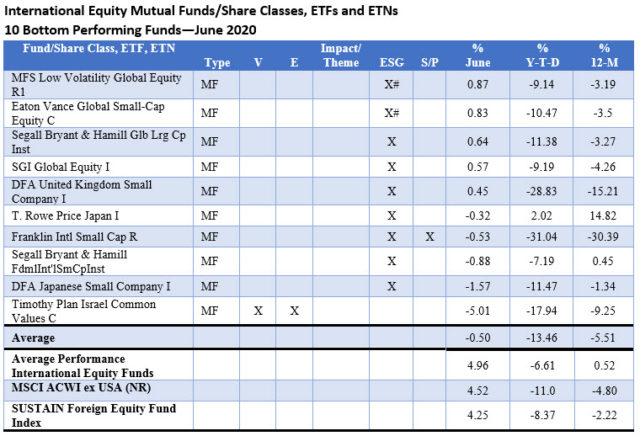
Small cap funds dominated the list of the 10 bottom performing international funds that together recorded an average drop of 0.50% in June. All but one fund employ an ESG Integration or ESG Integration-Mixed approach. Timothy Plan Israel Common Values Fund, the lowest performer that posted a -5.01% return, engages in a values-based strategy that relies on excluding securities issued by any company that is involved in the production or wholesale distribution of alcohol, tobacco, or gambling equipment, gambling enterprises, or which is involved, either directly or indirectly, in abortion or pornography, or promoting anti-family entertainment or alternative lifestyles.
Top/bottom fixed income funds-average performance 1.37%
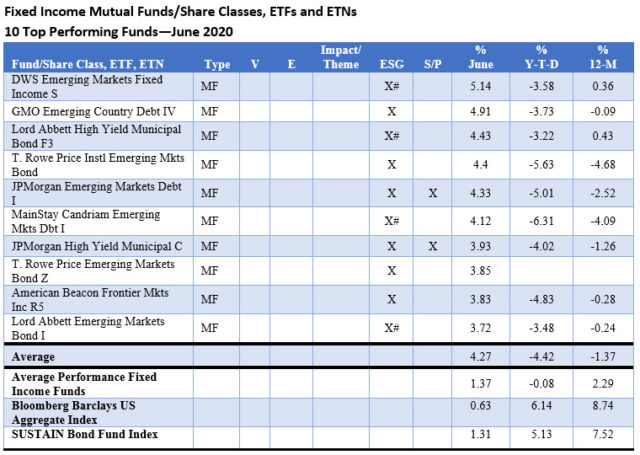
Top performing fixed income funds, all employing an ESG Integration-Consideration or ESG Integration investing approach, were dominated by emerging market debt funds and high yield municipals that delivered an average return of 4.27%. Returns ranged from a low of 3.72% to 5.14%. Four of the ten ESG integrators qualify their commitments to consider ESG in that they may but are not obligated to doing so.
At the other end of the range, the 10 bottom performing funds posted an average return of -0.59%, with results ranging from -0.03% to -3.12%. All but one fund pursues an ESG Integration approach, including three funds that employ an ESG Integration-Mixed strategy. The bottom fixed income fund performer in June, the Access Capital Community Investment Fund, pursues a thematic strategy focused on investing in high quality debt securities and other debt instruments supporting affordable housing and community development and servicing low-and moderate-income individuals and communities in areas of the United States designated by the fund’s shareholders.
Eight of the 10 lagging funds invest in world, international and high yield bonds, including the Neuberger Berman Short Duration High Income Fund that generated a -0.9% total return in June but trails badly for the year with its -17.17% return. This $4.7 million fund with a largely institutional shareholder base that was launched in 2012 announced that it was liquidating on or about August 17, 2020.

[1] While definitions continue to evolve, sustainable investing refers to a range of five overarching investing approaches or strategies that encompass: values-based investing, negative screening (exclusions), thematic and impact investing and ESG integration. These are not mutually exclusive and shareholder/bondholder engagement and proxy voting may be also be employed by any of the foregoing strategies.
Sustainable Funds Performance Scorecard: June 2020
The Bottom Line: Top and bottom performing mutual funds and ETFs in three categories are dominated by 34 funds that employ an ESG Integration strategy.
Share This Article:
The Bottom Line: Top and bottom performing mutual funds and ETFs in three categories are dominated by 34 funds that employ an ESG Integration strategy.
June markets summary
Ignoring the ravages of the COVID-19 pandemic that are still unfolding and focusing instead on the gradual progress made to contain and reverse the coronavirus pandemic, the barrage of fiscal and monetary stimulus programs and progress toward a breakthrough vaccine, the S&P 500 closed the month of June up 1.99% and registered a gain of 20.54% for the quarter. Outside the US, the MSCI All Country World, ex USA Index posted an increase of 4.5% in June and 16.1% in the quarter. Investment-grade intermediate bonds were up 0.6% in June and 6.1% year-to-date while high quality 20+ year government bonds were up 21.6% since the start of the year. Corporate credits led with a 1.8% gain in June but lagged behind Treasuries year-to-date at 4.8%.
ESG performance indicators
The universe of sustainable mutual funds and ETFs[1] across all asset classes and fund types, a total of 4,493 funds/share classes, gained an average 2.52% in June. Total returns ranged from a high of 27.59% recorded by the iPath Global Carbon ETN that provides exposure to the global price of carbon by referencing the price of carbon emissions credits from the world’s major emissions related mechanisms to a low of -6.21% posted by the AlphaCentric Energy Income Fund C, a thematic fund focusing on the infrastructure necessary to help drive the energy transition.
At the same time, the S&P 500 ESG Index added 2.45% in June and 20.57% in the quarter. This compares to lower gains for the conventional S&P 500 Index as well as the Sustainable (SUSTAIN) Large Cap Equity Fund Index. As for bonds, the Bloomberg Barclays MSCI US ESG Aggregate Focus Index recorded a gain of 0.59% in June and 2.82% in Q2 while its non-ESG counterpart performed slightly better, adding 0.62% in June and 2.92% in the second quarter. By way of comparison, the Sustainable (SUSTAIN) Bond Fund Index recorded beats in June and Q2. Completing the picture is the MSCI ACWI ex USA ESG Leaders Index which gained 5.0%, outperforming its conventional counterpart by 8 bps and the Sustainable (SUSTAIN) Foreign Equity Fund Index by 27 bps.
Top 10/bottom 10 performing funds
The 60 top and bottom performing funds in three investment categories, including US equity and sector funds, international equity and fixed income funds, both taxable and municipal, were dominated by 34 funds, or 57%, that employ an ESG Integration strategy. The rest, 9 funds or 15% follow an ESG Integration-Consideration approach and 2 funds pursue an ESG Integration-Mixed Approach. There were also four thematic funds and one fund pursues a values-based strategy.
For definitions, ESG Integration funds explicitly integrate ESG and may also engage with stakeholders. ESG Integration-Consideration covers funds that may integrate ESG while ESG Integration-Mixed refers to funds whose core strategy consists of ESG integration, but exclusions, impact or thematic approaches may also be employed.
Top/bottom US equity and sector equity funds-average performance 2.29%
Sustainable US equity and sector equity funds posted an average gain of 2.19% in June, but the top 10 performing funds, all but one employing an ESG Integration approach, outperformed by a factor of almost 6X with an average increase of 12.41%. The 10 fund performing funds are dominated by large and small cap growth funds. Invesco Wilderhill Clean Energy ETF, the best performer, is the exception. Registering a gain of 16.65%, the thematic fund is composed of stocks of publicly traded companies in the United States that are engaged in the business of the advancement of cleaner energy and conservation.
At the other end of the range, the 10 bottom performing funds produced an average -2.95% decline. Results ranged from -1.52% recorded by Morgan Stanley Institutional Global Infrastructure Fund L, a fund that by prospectus language integrates ESG, including engagement, to a negative -6.21% registered by Alphacentric Energy Income Fund C, a thematic fund that invests in equity and debt securities of domestic and foreign (including emerging markets) midstream energy infrastructure companies, renewable energy infrastructure companies and other issuers in the energy sector.
Top/bottom international equity funds-average performance 4.96%
The average performance of international equity funds was eclipsed by the 12.29% average performance of the 10 best performing funds in the category as funds with a China mandate, in particular, posted returns as low as 9.97% and as high as 20.65%. The top 10 funds include six offerings that employ an ESG integration approach and two that also combine exclusions along with ESG Integration, or ESG Integration-Mixed. The remaining funds, including KraneShares MSCI China Environment ETF and Guinness Atkinson Alternative Energy, pursue a thematic investment style.
Small cap funds dominated the list of the 10 bottom performing international funds that together recorded an average drop of 0.50% in June. All but one fund employ an ESG Integration or ESG Integration-Mixed approach. Timothy Plan Israel Common Values Fund, the lowest performer that posted a -5.01% return, engages in a values-based strategy that relies on excluding securities issued by any company that is involved in the production or wholesale distribution of alcohol, tobacco, or gambling equipment, gambling enterprises, or which is involved, either directly or indirectly, in abortion or pornography, or promoting anti-family entertainment or alternative lifestyles.
Top/bottom fixed income funds-average performance 1.37%
Top performing fixed income funds, all employing an ESG Integration-Consideration or ESG Integration investing approach, were dominated by emerging market debt funds and high yield municipals that delivered an average return of 4.27%. Returns ranged from a low of 3.72% to 5.14%. Four of the ten ESG integrators qualify their commitments to consider ESG in that they may but are not obligated to doing so.
At the other end of the range, the 10 bottom performing funds posted an average return of -0.59%, with results ranging from -0.03% to -3.12%. All but one fund pursues an ESG Integration approach, including three funds that employ an ESG Integration-Mixed strategy. The bottom fixed income fund performer in June, the Access Capital Community Investment Fund, pursues a thematic strategy focused on investing in high quality debt securities and other debt instruments supporting affordable housing and community development and servicing low-and moderate-income individuals and communities in areas of the United States designated by the fund’s shareholders.
Eight of the 10 lagging funds invest in world, international and high yield bonds, including the Neuberger Berman Short Duration High Income Fund that generated a -0.9% total return in June but trails badly for the year with its -17.17% return. This $4.7 million fund with a largely institutional shareholder base that was launched in 2012 announced that it was liquidating on or about August 17, 2020.
[1] While definitions continue to evolve, sustainable investing refers to a range of five overarching investing approaches or strategies that encompass: values-based investing, negative screening (exclusions), thematic and impact investing and ESG integration. These are not mutually exclusive and shareholder/bondholder engagement and proxy voting may be also be employed by any of the foregoing strategies.
Sustainableinvest.com
Benefits
Free access to regularly updated original research and analysis focused exclusively on sustainable finance and investing, providing investors with the guidance needed to make informed investment decisions that align with their personal values and financial goals while also contributing to the advancement of positive long-term environmental and social outcomes.
By offering financial support for our current work, either in the form of a one-time or regular contributions, you help to defray some of the costs associated with conducting our research and analysis as well as to maintain the www.sustainablest.wpengine.com website.
Helping us to expand our research capabilities and offerings over time to cover additional relevant topics geared to sustainable investors.
Sign up to free newsletters.
By submitting this form, you are consenting to receive marketing emails from: . You can revoke your consent to receive emails at any time by using the SafeUnsubscribe® link, found at the bottom of every email. Emails are serviced by Constant Contact