Assets attributable to sustainable funds declined by $8.4 billion in August largely due to market movement
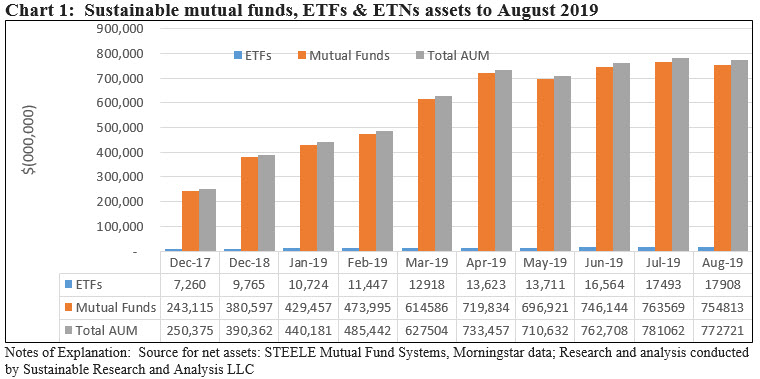
Sustainable funds, including mutual funds, exchange-traded funds (ETFs) and exchange-traded notes (ETNs), registered a decline in the amount of $8.4 billion, or 1.1% to end the month of August at $772.7 billion. This was only the second time this year that the total net assets (AUM) of sustainable funds declined on a month-over-month basis. Just as in May, the retreat was due to stock market declines in the US and overseas. The results would have been even worse if not for net positive cash flows. Investors added and estimated $3.3 billion while fund re-brandings and fund closures added $1.4 billion. Both of these positive inflows were offset by negative market movement and fund closings that reduced assets by $12.95 billion. Refer to Chart 1.
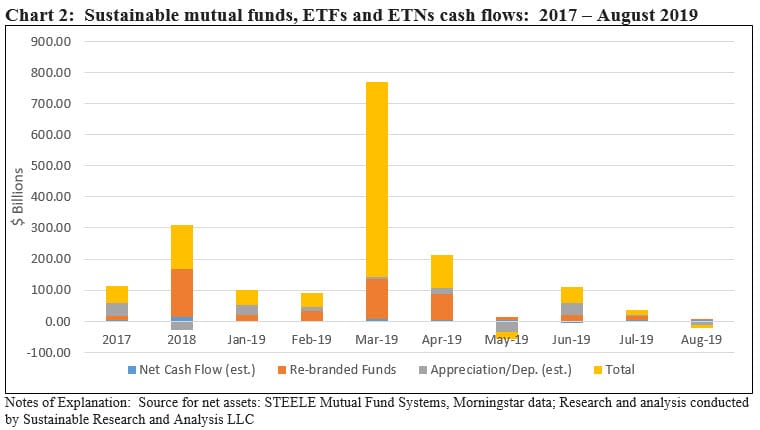
Since the start of the year, sustainable funds added $382.3 billion in net assets, or an increase of 98%. Of this sum, mutual funds contributed $374.2 billion while ETFs added $8.1 billion, gaining 83.4%. Also, fund re-brandings added $307.5 billion or 80.39% of the year-to-date gain across mutual funds and ETFs/ETNs while market movement contributed an estimated $58.9 billion or 15.4% and net positive cash flows supplied about $16 billion or 4.21%. Refer to Chart 2.
Sustainable mutual funds versus ETFs: Mutual fund assets decline while ETFs gain assets under management
Mutual funds ended the month of August with $754.8 billion, giving up some $8.8 billion relative to July’s $763.6 billion. Mutual funds represent 97.7% of sustainable assets under management—unchanged relative to July. Sustainable ETFs on the other hand gained $416 million to end the month of August at $17.9 billion versus $17.5 billion the previous month.
Fixed income funds versus equity funds
Fixed income assets ended the month of August with $133.8 billion in assets, or 17.3% of total sustainable assets versus equity and all other funds that closed in August with $638.9 billion, or 82.7% of sustainable assets under management. Fixed income funds gained almost $1.9 billion in assets while equity funds and all other related funds gave up $10.2 billion.
Since the start of the year, fixed income mutual funds added $106.0 billion in net assets or an increase of 403.8% due largely to fund re-brandings during the first eight months of the year. Equity funds, on the other hand, brought in an even greater combined total of $275.9 billion which on a percentage basis places this segment up 76%.
Repurposed or re-branded funds: Lowest level so far this year, with just two firms shifting $1.4 billion in assets
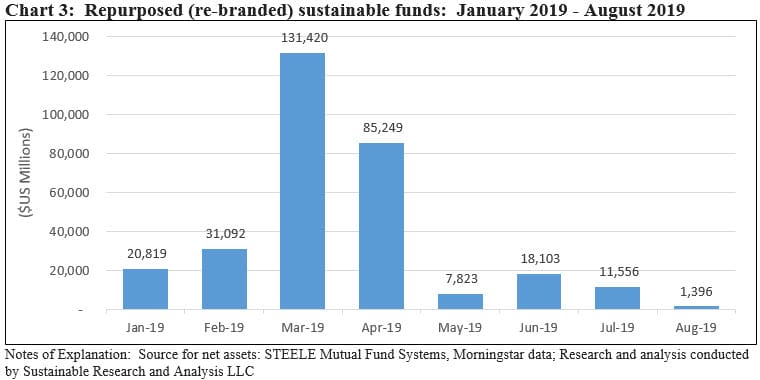
Just two fund firms repurposed or re-branded existing funds in August, bringing along $1,395.6 million in net assets. These include the American Century NT Equity Growth Fund G shares with $1,385.5 million in assets and the Mesirow Financial Small Cap Value Sustainable Fund, launched in November 2018, with $10.1 million in net assets.
August’s level of fund re-brandings is the lowest so far this year which has been averaging $38.4 billion per month with March representing the high water mark when we observed $131.4 billion in fund re-brandings. Refer to Chart 3.
New Funds: One new ETF launched in August, adding $2.0 million in net assets
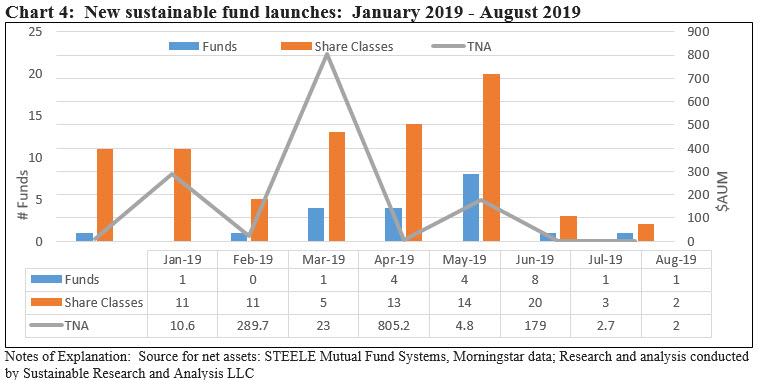
The First Trust EIP Carbon Impact ETF was the only new fund launch in August. Advised by First Trust Advisors L.P. and sub-advised by Energy Income Partners, LLC, the fund invests at least 80% of its net assets (including investment borrowings) in the equity securities of companies identified by Energy Income Partners, LLC as having or seeking to have a positive carbon impact. Positive carbon impact has been defined to include companies that reduce, have a publicly available plan to reduce, or enable the reduction of carbon and other greenhouse gas (GHG) emissions from the production, transportation, conversion, storage and use of energy. The companies in which the fund invests will have demonstrated a commitment to positive carbon impact activities, as determined by the sub-adviser. Examples of positive carbon impact activities include investing capital in activities and technologies with lower GHG emissions, such as wind and solar power generation, or by replacing coal fired power generation facilities with natural gas power generation facilities.
Since the start of the year, 21 new funds have been launched, comprised of 78 share classes that have attracted a total of $1.3 billion in assets. At only $2.0 million, August saw the smallest capital raise so far this year attributable to new funds. Refer to Chart 4.
Fund Closings: Two funds and one ETF offered by three firms shut down
Calvert Investments liquidated the $10 million Calvert Ultra Short Duration NEXT ETF. Also, JP Morgan liquidated and dissolved the $66 million JP Morgan International Equity Income Fund on or about August 8th while Baywood Funds closed its Baywood Socially Responsible Fund Investor shares (managed by SKBA Capital Management, LLC) and seems to have transferred the assets to the Baywood Socially Responsible Fund Institutional shares that closed August with $3.8 million in net assets.
Institutional investors: Assets sourced to institutional investors declined by $4.2 billion to $340.5 billion
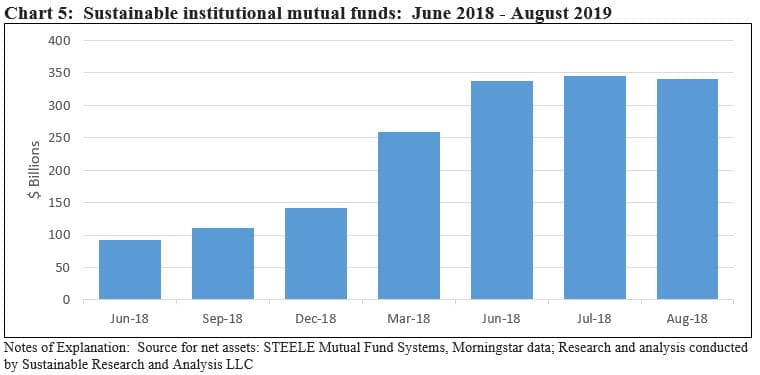
Sustainable assets under management sourced to institutional investors dropped to $340.5 billion, giving up $4.2 billion on a month-over-month basis. This segment declined slightly from 45.2% of sustainable assets to 44.1% of total sustainable mutual fund assets under management. Refer to Chart 5.
Index funds drop $1.8 billion
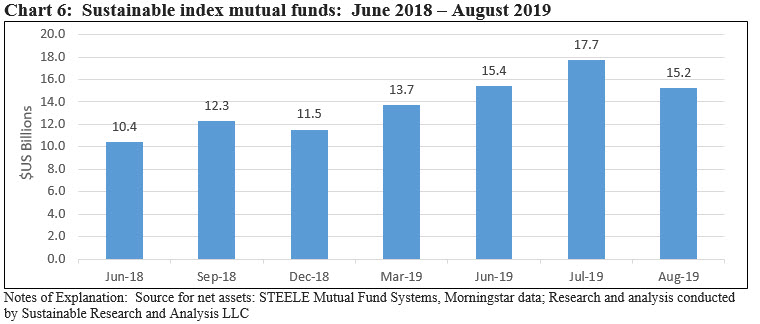
Sustainable index mutual fund assets dropped $1.8 billion and declined to $15,228.8 million in net assets across 50 funds/share classes as of August 2019. The 10.8% decline is largely attributable to a $1.4 billion outflow in August from the Vanguard FTSE Social Index Fund Inv. shares. Refer to Chart 6.
Largest Fund Groups: Top 20 sustainable fund groups = $679 billion and account for 87.9% of net assets, unchanged versus July
A total of 146 fund groups, unchanged from last month, offered sustainable mutual funds and ETFs at August 2019. Of these, the largest 20 fund groups account for $678,956.6 million or 87.9% of net assets. Refer to Table 1.
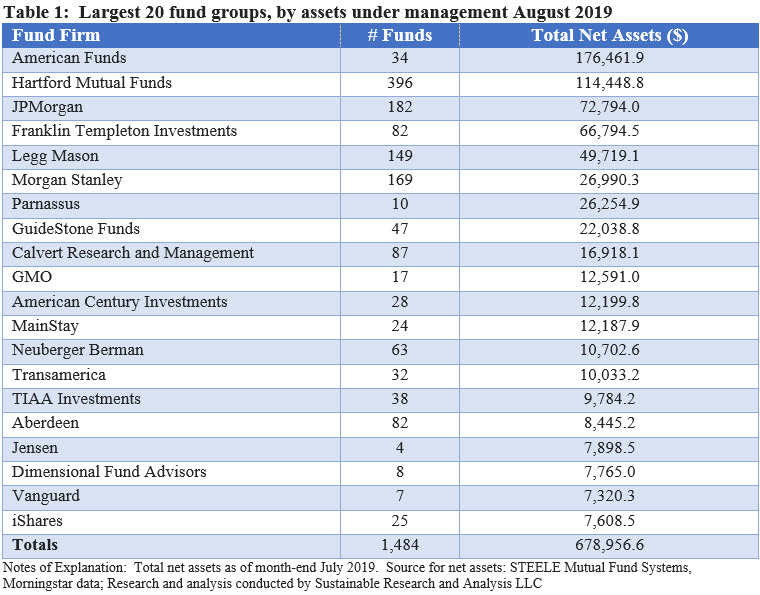
There was no change in the composition of the top 20 firms, and there was no movement in the ranking of the top 10 firms. Of note regarding the rankings of the next 10 firms is that BlackRock/iShares eclipsed Vanguard which landed in 20th place with its sustainable assets in the amount of $$7.3 billion versus BlackRock/iShares $7.6 billion at the end of August.
Largest Sustainable Equity Funds: No change in the composition of the top 10 sustainable equity funds
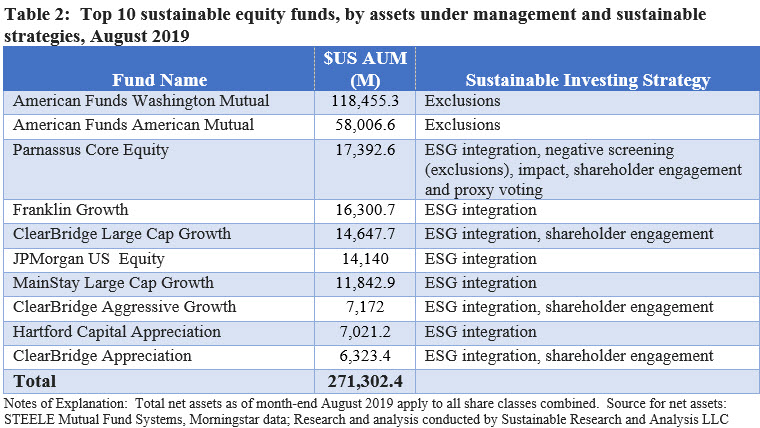
While net assets sourced to the largest 10 equity funds (including all funds but bond funds) declined by $2.1 billion, the composition of the top 10 funds was unchanged relative to the previous month. As was the case in July, ESG integration dominates the sustainable investing approach practiced by the top 10 funds, with eight of 10 funds falling into this category.
The top two funds, both managed by American Funds with a combined total of $176.5 billion in net assets, or 65% of the top 10 funds, restrict themselves to excluding companies that derive the majority of their revenues from alcohol or tobacco products. Otherwise, the remaining eight funds approach sustainable investing by formally integrating ESG; and in the case of four of these funds, sustainable investing extents to include shareholder engagement. One fund, Parnassus Core Equity employs a broader array of sustainable strategies. Refer to Table 2.
Largest Bond Funds: No change in the composition of the top 10 sustainable bond funds
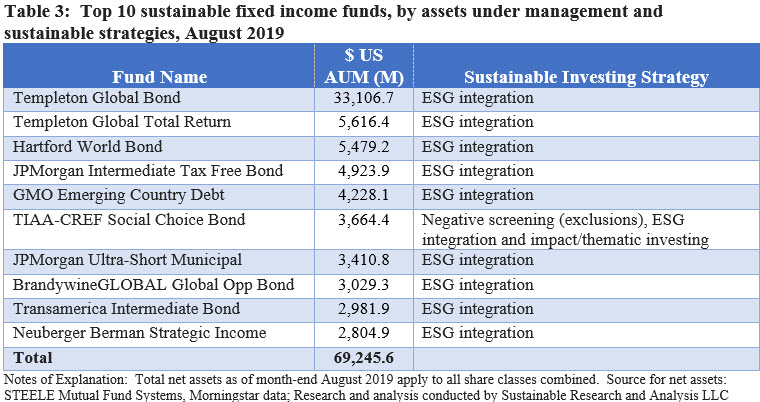
The largest 10 sustainable bond funds gained assets in August, adding $183 million in net assets to end the month with $69.3 billion in assets or almost 52% of the segment’s total assets under management.
All ten funds approach sustainable investing by formally integrating ESG. One fund, the TIAA-CREF Social Choice Bond Fund, employs a broader array of sustainable strategies. Refer to Table 3.
Fund Flows: Biggest winners and losers are Templeton Global Bond Adv. and Vanguard FTSE Social Index Inv shares
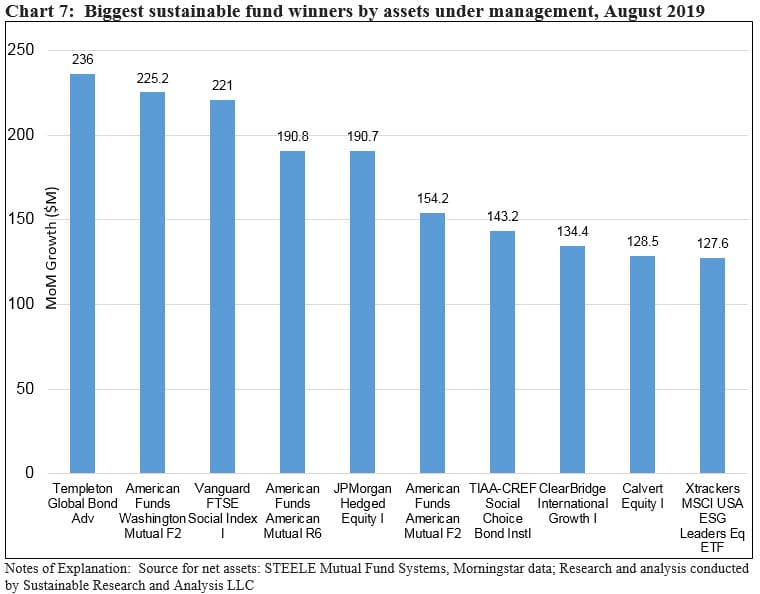
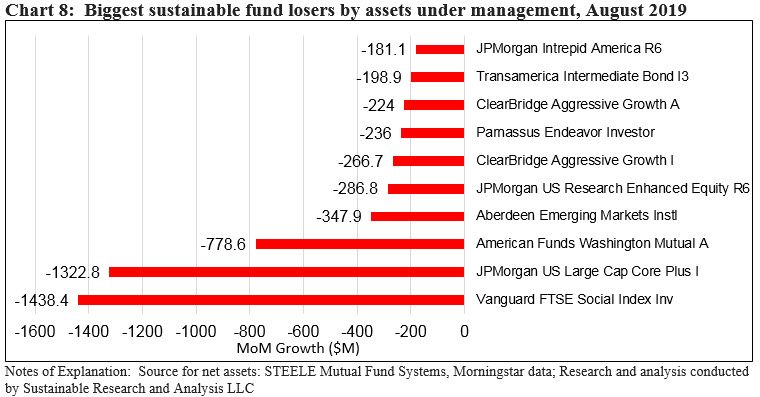
The biggest net asset gainers in August were Templeton Global Bond Adv, American Funds Washington Mutual F2, and Vanguard FTSE Social Index I shares, each fund gaining between $236 million and $221 million. At the other end of the spectrum, the Vanguard FTSE Social Index Inv. shares experienced a net decline in the amount of $1.4 billion while JP Morgan US Large Cap Core Plus Fund I and American Funds Washington Mutual Fund A each saw drops of $1.3 billion and $779 million, respectively. Refer to Chart 7 and Chart 8.
