The Bottom Line: Markets in January posted mixed results ranging from -11.88% to 6.99%. Two SUSTAIN Indices outperformed while the third lagged by 10 bps.
Markets in January reversed course and posted mixed results ranging from -11.88% to 6.99%
Markets in January reversed course in response to news of the coronavirus outbreak in the third week of January, posting mixed results ranging from a high of 6.99% recorded by 20+ year US Treasury securities to a low of -11.88% for Brent Crude. The S&P 500 ended slightly in the red, finishing the month at -0.04% after a strong start that fizzled out while the Bloomberg Barclays US Aggregate Index gained 1.92%–its best performance in five months. The yield on 10-year US Treasury bonds declined 41 basis points during the month with slightly over 80% of that decline registered following news of the coronavirus outbreak. Technology stocks turned in a strong performance, with the NASDAQ 100 posting a gain of 3.01%. Overseas, the MSCI ACWI, ex USA Index (Net) finished at -1.94%, while Europe, emerging markets and China posted even lower results at -2.09%, -4.66% and -4.8%, in that order. Small company stocks performed even worse, giving up -3.21% and growth stocks across the market cap continuum turned in much strong results versus their value counterparts. Sustainable investing funds,[1] including mutual funds and ETFs, posted an average decline of -0.46%, but variations across fund types and sectors ranged from an average of 1.11% for fixed income funds to an average of -1.08% and 2.45%, respectively, for US equity and related funds and international funds. At the same time, the Sustainable (SUSTAIN) Large Cap Equity Fund Index trailed the S&P 500 while the SUSTAIN Bond Fund Index and Foreign Equity Fund Index both outperformed.
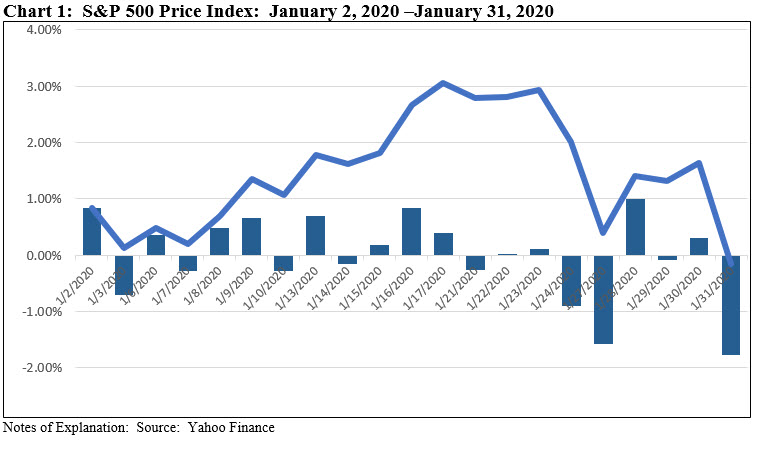
After an outstanding year in 2019 when the S&P 500 registered a gain of 31.5% and bonds added 8.7%, markets continued to press ahead during the first two full weeks of January through January 17 on optimism that global growth could rebound based on improved economic data across regions and accommodative major central banks. Shrugged off were escalating Iran tensions following the US drone killing of an Iranian Revolutionary Guard General, domestic political angst surrounding the impeachment proceedings of President Trump and the upcoming official EU exit scheduled to take effect on January 31st. These considerations were eclipsed by the lead up to the signing of the phase one trade deal between the US and China on January 15. This was viewed as welcome news, representing a thawing of tensions even as significant tariffs will remain in place and key structural issues were left unresolved and subject to negotiations during the next phase of trade talks. The S&P 500 was up as much as 3.6% on January 17th having registered gains in eight of the twelve trading sessions. Refer to Chart 1. But the market reversed course in response to news of the outbreak of the latest coronavirus that originated in Wuhan, China and the World Health Organization declared a public health emergency of international concerns as the virus by the end of the month was reported to have infected more than 17,000 people with 362 confirmed fatalities. Anxiety over the economic impact of the virus swept through the stock, bond and commodity markets as investors were attempting to calibrate the potential economic consequences. US stocks moved lower during the following nine trading days of January and volatility kicked-up with two trading days registering declines in excess of 1%. Crude oil was hit particularly hard due to prospects for a weaker global economy. Energy was the worst performing sector in the S&P 500, dropping -7.95% in January while the safe have Utility sector was up 7.59%. As a consequence, sustainable funds with limited or no exposure to fossil fuels benefited from this development.
On January 30, the Department of Commerce Bureau of Economic Analysis released its initial estimate for fourth quarter real GDP, reporting that the U.S. economy grew 2.1% and 2.3% for the full year, closing out a year in which gross domestic product decelerated to its slowest pace in three years amid a continuing drag in business investment offset in part by continued gains in consumer spending. This matched expectations but was below the 2.9% increase achieved in 2018 as well as the 2.4% gain in 2017 and was well below the White House’s projections following the 2017 tax revamp. With the economy evolving broadly in line with the Federal Reserve’s outlook of moderate economic growth and a strong labor market, the decision to keep the key interest rate unchanged at the January meeting came as no surprise to markets. Also the US earnings season for the fourth quarter of last year was well underway, with companies so far doing better than expected. Earnings per share and sales are growing at 6% and 2% year on year, respectively for the S&P 500.
Overseas, European growth remains positive but tepid while China, already in the midst of a slower but perhaps stabilizing economy at 6.0% year-on-year growth in the fourth quarter of 2019, could be negatively impacted by the coronavirus outbreak.
Sustainable (SUSTAIN) Large Cap Equity Fund Index trails S&P 500 by 10 basis points
The SUSTAIN Large Cap Equity Fund Index, which was reconstituted as of December 31, 2019 to reflect the latest rank ordering of funds by total net assets and common investment and sustainable investing strategies combined, trailed the S&P 500 in January by 10 basis points (bps). Five funds outperformed the conventional index while a sixth matched the S&P 500. Refer to Table 1. The two best performing large cap blend funds that are also alike in that they each pursue an ESG integration strategy, the $1.1 billion Nationwide Fund Institutional Service Shares and the $15.7 billion JPMorgan US Equity Fund R6, were up 1.17% and 1.05%, respectively. While their sector exposures were largely neutral, they both benefited from their respective, almost 20% combined exposures to Apple, Amazon.com, Microsoft and Google. These stocks each added between 5.4% and 8.71% in January. This was not the case for the 10th ranked fund by performance, the Neuberger Berman Sustainable Equity Fund Institutional Shares, which came in at -1.84%. The $1.9 billion fund was underweight the technology sector while its top holdings, with the exception of a 4.18% exposure to Microsoft, sidestepped the leading technology firms. Also detracting from performance, the fund maintained an 18.15% position in non-US equity securities that didn’t deliver results in line with the US stock market in January.
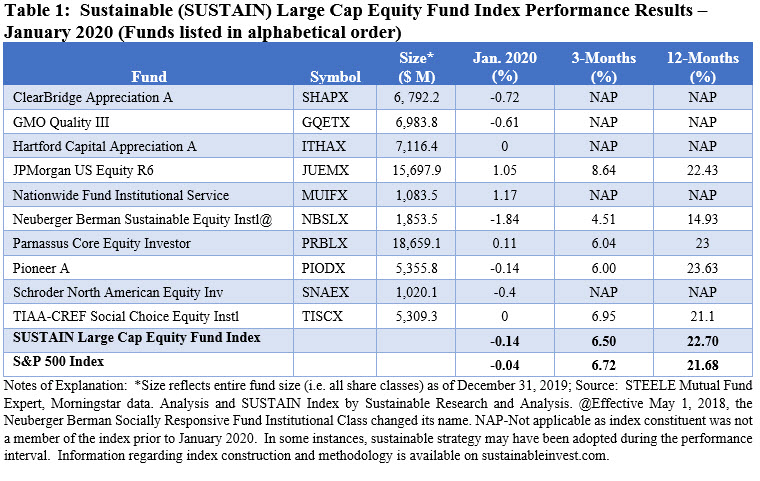
The SUSTAIN Larger Cap Equity Fund Index reversed course relative to December when it was up 2.92%. For the trailing 3-months, the SUSTAIN Equity Index lags the conventional S&P 500 by 22 basis points but leads over the 12-month interval by 2 bps. The 12-month results were boosted by the performance of Pioneer A, the best performing fund during this interval, followed by JPMorgan US Equity R9. Since inception as of December 31, 2016, sustainable funds are trailing behind the S&P 500 by 4.12%. Refer to Chart 2.
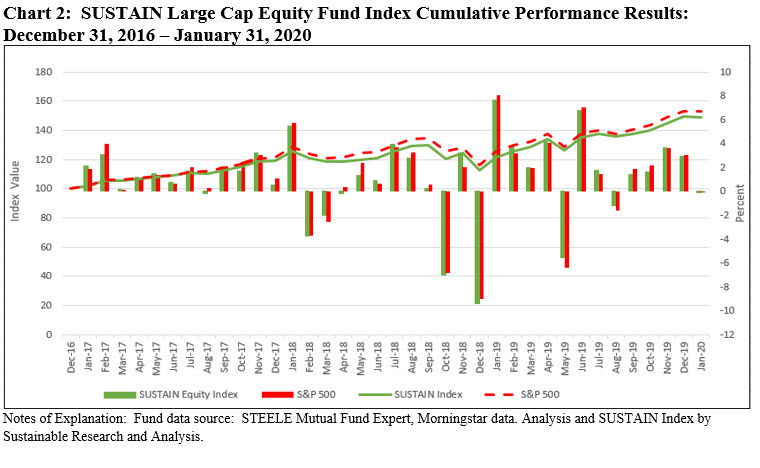
In the reconstitution process as of December 31, 2019, four replacement funds/share classes were added, including ClearBridge Appreciation A, GMO Quality III, Nationwide Fund Institutional Service Shares and Schroder North America Equity Inv Shares. In total, the ten funds that comprise the index managed $63.1 billion in net assets and represent 11.3% of the large cap sustainable funds equity segment made up of actively managed mutual funds and ETFs as of December 31, 2019.
Sustainable (SUSTAIN) Bond Fund Index pulls ahead of the Bloomberg Barclays US Aggregate Index for the first time in six months
The Sustainable (SUSTAIN) Bond Fund Index, which posted two back-to-back months of negative returns, turned positive in January and also pulled ahead of the Bloomberg Barclays US Aggregate Index for the first time in six months. The SUSTAIN Index outperformed by 11 bps while trailing over the previous 3-months and leading the conventional benchmark by 16 bps during the 12-months to January 31st. Refer to Table 2 and Chart 3.
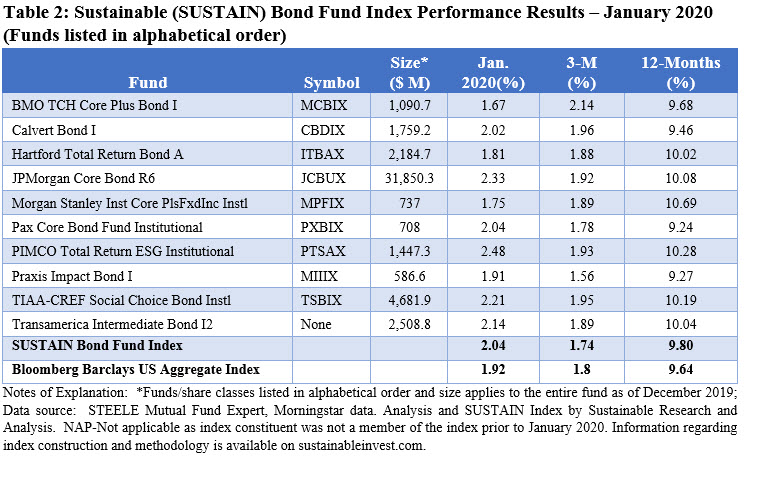
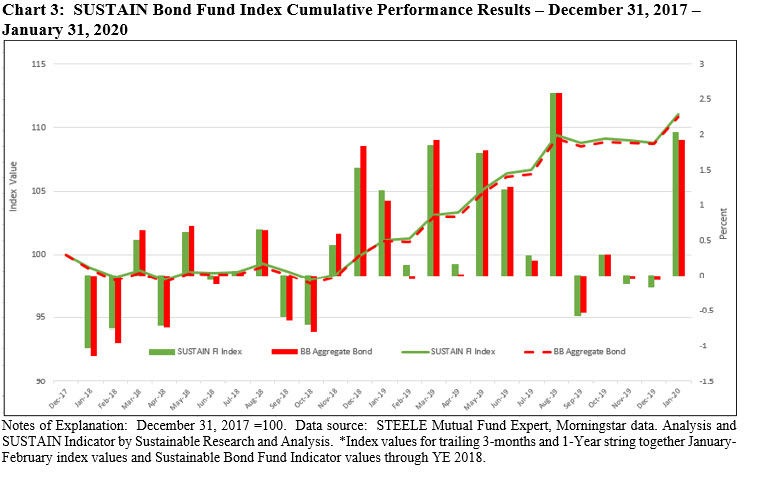
Six funds outperformed the Bloomberg Barclays US Aggregate Index in January, including two sustainable bond funds that were added to the reconstituted SUSTAIN Index based on total net assets as of December 31, 2019. In the reconstitution process, four replacement funds/share classes were added, including the BMO TCH Core Plus Bond I, Hartford Total Return Bond A, JPMorgan Core Bond R6 and Transamerica Intermediate Bond I2, based on their total net assets, investment strategy and approach to sustainable investing. In total, the ten funds that comprise the index managed $47.6 billion in net assets and represent 53.8% of the taxable intermediate core and core plus sustainable segment made up of actively managed mutual funds and ETFS as of December 31, 2019.
Top performing SUSTAIN Bond Fund Index members in January included PIMCO Total Return ESG Institutional Shares JPMorgan Core Bond Fund R6, and TIAA-CREF Social Choice Bond Fund Institutional Shares with their returns of 2.48%, 2.33% and 2.21%, respectively. These funds which at their core integrate ESG and maintain active company engagements, seem to have achieved their excess returns via different investment bets. Both PIMCO and JPMorgan maintained higher levels of exposure to securitized debt versus corporate bond obligations whereas TIAA-CREF, at 47.76%, invested a far higher proportion of assets in corporate debt. The same fund also maintained a higher average effective maturity which likely contributed to the fund’s performance in January given the higher returns achieve by longer dated securities in a declining rate environment.
At the other end of the range, the $1.1 billion (as of 1/31) BMO Core Plus Bond Fund Class I, which adopted an ESG integration strategy in December 2019, posted a 1.67% return in January. The fund entered 2020 with an effective maturity of 8.40 years versus 8.12 years for the Bloomberg Barclays US Aggregate Index. At the same time, the fund maintained a slightly higher average A credit quality while significantly underweighting US Government securities.
Sustainable (SUSTAIN) Foreign Equity Fund Index beats MSCI ACWI, ex US (Net) Index by 1.49%
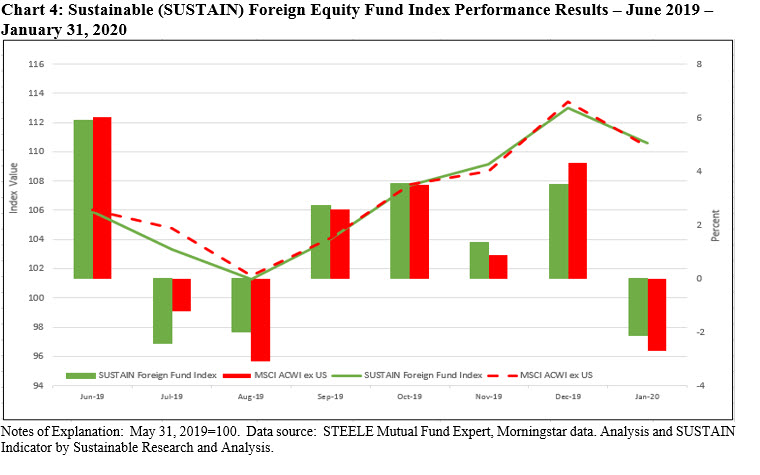
After registering positive results for four consecutive months, the reconstituted SUSTAIN Foreign Equity Fund Index dropped -2.14% versus a decline of -2.69% posted by the MSCI ACWI, ex US (Net) Index. The SUSTAIN Index was lifted by the outperformance of nine of ten funds that comprise the benchmark that ranged from as few as 6 bps to 149 basis points. While its track record is still limited, having been launched as of June 30, 2019, the SUSTAIN Index also outperforms the conventional index over the trailing 3-month interval. Refer to Table 3 and Chart 4.
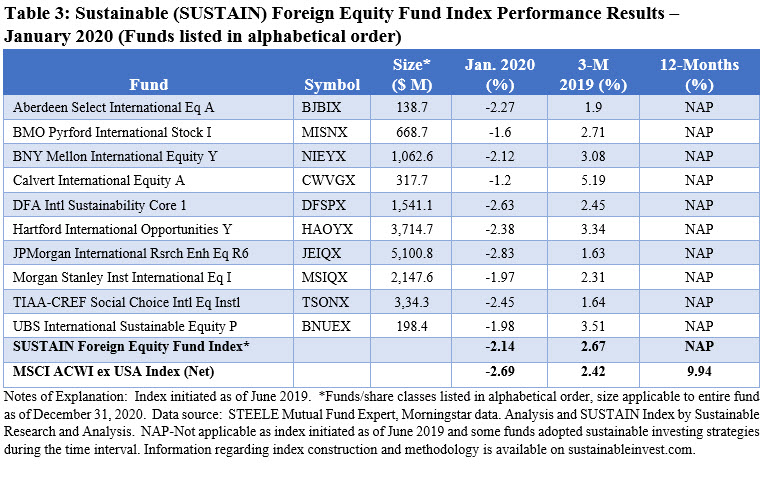
The best performers in January are both newly added to the reconstituted SUSTAIN Index as of December 31st, the $318.7 million Calvert International Equity Fund A Shares sub-advised by Eaton Vance Advisers International Ltd and the $668.7 million BMO Pyrford International Stock Fund I Shares, sub-advised by Pyrford International Ltd, a unit of Bank of Montreal. Calvert International benefited from both stock selection and sector allocation, and in terms of its 2019 performance, an out-of-benchmark position in Taiwan along with an overweight position in Sweden benefited the fund’s return. That said, Taiwan backed off in January, dropping about 4%. Coming into January 2020, the fund’s top 3 positions, accounting for almost 10% of fund assets, were Nestle SA, AIA Group Limited and Sika AG. While not impacting the SUSTAIN Index results, these factors also contributed to Calvert International’s 23.35% results achieved over the previous 12-months versus the 9.94% return registered by the MSCI ACWI ex USA (Net).
The JPMorgan International Research Enhanced Equity Fund R6 Shares, which also eclipsed the conventional benchmark on a trailing 12-month basis, trailed in January. The fund, which integrates ESG and seeks to outperform the benchmark MSCI Index by modestly overweighting equity securities that it considers undervalued and modestly underweighting or not holding equity securities that appear overvalued while maintaining similar sector, geographic and risk characteristics, lagged behind its SUSTAIN Index counterparts with its return of -2.83%.
In the reconstitution process as of December 31, 2019, four replacement funds/share classes were added. In addition to the two funds referenced above, these also included Aberdeen Select International Equity A Shares and UBS International Sustainable Equity P Shares. In total, the ten funds that comprise the index managed $14.9 billion in net assets and represent 43% of the foreign equity world large cap funds segment made of actively managed mutual funds and ETFs as of December 31, 2019.
[1] While definitions continue to evolve, sustainable investing refers to a range of five overarching investing approaches or strategies that encompass: values-based investing, negative screening (exclusions), thematic and impact investing, ESG integration and shareholder/bondholder engagement and proxy voting. These are not mutually exclusive.
Sustainable Fund Indices Post Better than Average Results in January 2020
The Bottom Line: Markets in January posted mixed results ranging from -11.88% to 6.99%. Two SUSTAIN Indices outperformed while the third lagged by 10 bps.
Share This Article:
The Bottom Line: Markets in January posted mixed results ranging from -11.88% to 6.99%. Two SUSTAIN Indices outperformed while the third lagged by 10 bps.
Markets in January reversed course and posted mixed results ranging from -11.88% to 6.99%
Markets in January reversed course in response to news of the coronavirus outbreak in the third week of January, posting mixed results ranging from a high of 6.99% recorded by 20+ year US Treasury securities to a low of -11.88% for Brent Crude. The S&P 500 ended slightly in the red, finishing the month at -0.04% after a strong start that fizzled out while the Bloomberg Barclays US Aggregate Index gained 1.92%–its best performance in five months. The yield on 10-year US Treasury bonds declined 41 basis points during the month with slightly over 80% of that decline registered following news of the coronavirus outbreak. Technology stocks turned in a strong performance, with the NASDAQ 100 posting a gain of 3.01%. Overseas, the MSCI ACWI, ex USA Index (Net) finished at -1.94%, while Europe, emerging markets and China posted even lower results at -2.09%, -4.66% and -4.8%, in that order. Small company stocks performed even worse, giving up -3.21% and growth stocks across the market cap continuum turned in much strong results versus their value counterparts. Sustainable investing funds,[1] including mutual funds and ETFs, posted an average decline of -0.46%, but variations across fund types and sectors ranged from an average of 1.11% for fixed income funds to an average of -1.08% and 2.45%, respectively, for US equity and related funds and international funds. At the same time, the Sustainable (SUSTAIN) Large Cap Equity Fund Index trailed the S&P 500 while the SUSTAIN Bond Fund Index and Foreign Equity Fund Index both outperformed.
After an outstanding year in 2019 when the S&P 500 registered a gain of 31.5% and bonds added 8.7%, markets continued to press ahead during the first two full weeks of January through January 17 on optimism that global growth could rebound based on improved economic data across regions and accommodative major central banks. Shrugged off were escalating Iran tensions following the US drone killing of an Iranian Revolutionary Guard General, domestic political angst surrounding the impeachment proceedings of President Trump and the upcoming official EU exit scheduled to take effect on January 31st. These considerations were eclipsed by the lead up to the signing of the phase one trade deal between the US and China on January 15. This was viewed as welcome news, representing a thawing of tensions even as significant tariffs will remain in place and key structural issues were left unresolved and subject to negotiations during the next phase of trade talks. The S&P 500 was up as much as 3.6% on January 17th having registered gains in eight of the twelve trading sessions. Refer to Chart 1. But the market reversed course in response to news of the outbreak of the latest coronavirus that originated in Wuhan, China and the World Health Organization declared a public health emergency of international concerns as the virus by the end of the month was reported to have infected more than 17,000 people with 362 confirmed fatalities. Anxiety over the economic impact of the virus swept through the stock, bond and commodity markets as investors were attempting to calibrate the potential economic consequences. US stocks moved lower during the following nine trading days of January and volatility kicked-up with two trading days registering declines in excess of 1%. Crude oil was hit particularly hard due to prospects for a weaker global economy. Energy was the worst performing sector in the S&P 500, dropping -7.95% in January while the safe have Utility sector was up 7.59%. As a consequence, sustainable funds with limited or no exposure to fossil fuels benefited from this development.
On January 30, the Department of Commerce Bureau of Economic Analysis released its initial estimate for fourth quarter real GDP, reporting that the U.S. economy grew 2.1% and 2.3% for the full year, closing out a year in which gross domestic product decelerated to its slowest pace in three years amid a continuing drag in business investment offset in part by continued gains in consumer spending. This matched expectations but was below the 2.9% increase achieved in 2018 as well as the 2.4% gain in 2017 and was well below the White House’s projections following the 2017 tax revamp. With the economy evolving broadly in line with the Federal Reserve’s outlook of moderate economic growth and a strong labor market, the decision to keep the key interest rate unchanged at the January meeting came as no surprise to markets. Also the US earnings season for the fourth quarter of last year was well underway, with companies so far doing better than expected. Earnings per share and sales are growing at 6% and 2% year on year, respectively for the S&P 500.
Overseas, European growth remains positive but tepid while China, already in the midst of a slower but perhaps stabilizing economy at 6.0% year-on-year growth in the fourth quarter of 2019, could be negatively impacted by the coronavirus outbreak.
Sustainable (SUSTAIN) Large Cap Equity Fund Index trails S&P 500 by 10 basis points
The SUSTAIN Large Cap Equity Fund Index, which was reconstituted as of December 31, 2019 to reflect the latest rank ordering of funds by total net assets and common investment and sustainable investing strategies combined, trailed the S&P 500 in January by 10 basis points (bps). Five funds outperformed the conventional index while a sixth matched the S&P 500. Refer to Table 1. The two best performing large cap blend funds that are also alike in that they each pursue an ESG integration strategy, the $1.1 billion Nationwide Fund Institutional Service Shares and the $15.7 billion JPMorgan US Equity Fund R6, were up 1.17% and 1.05%, respectively. While their sector exposures were largely neutral, they both benefited from their respective, almost 20% combined exposures to Apple, Amazon.com, Microsoft and Google. These stocks each added between 5.4% and 8.71% in January. This was not the case for the 10th ranked fund by performance, the Neuberger Berman Sustainable Equity Fund Institutional Shares, which came in at -1.84%. The $1.9 billion fund was underweight the technology sector while its top holdings, with the exception of a 4.18% exposure to Microsoft, sidestepped the leading technology firms. Also detracting from performance, the fund maintained an 18.15% position in non-US equity securities that didn’t deliver results in line with the US stock market in January.
The SUSTAIN Larger Cap Equity Fund Index reversed course relative to December when it was up 2.92%. For the trailing 3-months, the SUSTAIN Equity Index lags the conventional S&P 500 by 22 basis points but leads over the 12-month interval by 2 bps. The 12-month results were boosted by the performance of Pioneer A, the best performing fund during this interval, followed by JPMorgan US Equity R9. Since inception as of December 31, 2016, sustainable funds are trailing behind the S&P 500 by 4.12%. Refer to Chart 2.
In the reconstitution process as of December 31, 2019, four replacement funds/share classes were added, including ClearBridge Appreciation A, GMO Quality III, Nationwide Fund Institutional Service Shares and Schroder North America Equity Inv Shares. In total, the ten funds that comprise the index managed $63.1 billion in net assets and represent 11.3% of the large cap sustainable funds equity segment made up of actively managed mutual funds and ETFs as of December 31, 2019.
Sustainable (SUSTAIN) Bond Fund Index pulls ahead of the Bloomberg Barclays US Aggregate Index for the first time in six months
The Sustainable (SUSTAIN) Bond Fund Index, which posted two back-to-back months of negative returns, turned positive in January and also pulled ahead of the Bloomberg Barclays US Aggregate Index for the first time in six months. The SUSTAIN Index outperformed by 11 bps while trailing over the previous 3-months and leading the conventional benchmark by 16 bps during the 12-months to January 31st. Refer to Table 2 and Chart 3.
Six funds outperformed the Bloomberg Barclays US Aggregate Index in January, including two sustainable bond funds that were added to the reconstituted SUSTAIN Index based on total net assets as of December 31, 2019. In the reconstitution process, four replacement funds/share classes were added, including the BMO TCH Core Plus Bond I, Hartford Total Return Bond A, JPMorgan Core Bond R6 and Transamerica Intermediate Bond I2, based on their total net assets, investment strategy and approach to sustainable investing. In total, the ten funds that comprise the index managed $47.6 billion in net assets and represent 53.8% of the taxable intermediate core and core plus sustainable segment made up of actively managed mutual funds and ETFS as of December 31, 2019.
Top performing SUSTAIN Bond Fund Index members in January included PIMCO Total Return ESG Institutional Shares JPMorgan Core Bond Fund R6, and TIAA-CREF Social Choice Bond Fund Institutional Shares with their returns of 2.48%, 2.33% and 2.21%, respectively. These funds which at their core integrate ESG and maintain active company engagements, seem to have achieved their excess returns via different investment bets. Both PIMCO and JPMorgan maintained higher levels of exposure to securitized debt versus corporate bond obligations whereas TIAA-CREF, at 47.76%, invested a far higher proportion of assets in corporate debt. The same fund also maintained a higher average effective maturity which likely contributed to the fund’s performance in January given the higher returns achieve by longer dated securities in a declining rate environment.
At the other end of the range, the $1.1 billion (as of 1/31) BMO Core Plus Bond Fund Class I, which adopted an ESG integration strategy in December 2019, posted a 1.67% return in January. The fund entered 2020 with an effective maturity of 8.40 years versus 8.12 years for the Bloomberg Barclays US Aggregate Index. At the same time, the fund maintained a slightly higher average A credit quality while significantly underweighting US Government securities.
Sustainable (SUSTAIN) Foreign Equity Fund Index beats MSCI ACWI, ex US (Net) Index by 1.49%
After registering positive results for four consecutive months, the reconstituted SUSTAIN Foreign Equity Fund Index dropped -2.14% versus a decline of -2.69% posted by the MSCI ACWI, ex US (Net) Index. The SUSTAIN Index was lifted by the outperformance of nine of ten funds that comprise the benchmark that ranged from as few as 6 bps to 149 basis points. While its track record is still limited, having been launched as of June 30, 2019, the SUSTAIN Index also outperforms the conventional index over the trailing 3-month interval. Refer to Table 3 and Chart 4.
The best performers in January are both newly added to the reconstituted SUSTAIN Index as of December 31st, the $318.7 million Calvert International Equity Fund A Shares sub-advised by Eaton Vance Advisers International Ltd and the $668.7 million BMO Pyrford International Stock Fund I Shares, sub-advised by Pyrford International Ltd, a unit of Bank of Montreal. Calvert International benefited from both stock selection and sector allocation, and in terms of its 2019 performance, an out-of-benchmark position in Taiwan along with an overweight position in Sweden benefited the fund’s return. That said, Taiwan backed off in January, dropping about 4%. Coming into January 2020, the fund’s top 3 positions, accounting for almost 10% of fund assets, were Nestle SA, AIA Group Limited and Sika AG. While not impacting the SUSTAIN Index results, these factors also contributed to Calvert International’s 23.35% results achieved over the previous 12-months versus the 9.94% return registered by the MSCI ACWI ex USA (Net).
The JPMorgan International Research Enhanced Equity Fund R6 Shares, which also eclipsed the conventional benchmark on a trailing 12-month basis, trailed in January. The fund, which integrates ESG and seeks to outperform the benchmark MSCI Index by modestly overweighting equity securities that it considers undervalued and modestly underweighting or not holding equity securities that appear overvalued while maintaining similar sector, geographic and risk characteristics, lagged behind its SUSTAIN Index counterparts with its return of -2.83%.
In the reconstitution process as of December 31, 2019, four replacement funds/share classes were added. In addition to the two funds referenced above, these also included Aberdeen Select International Equity A Shares and UBS International Sustainable Equity P Shares. In total, the ten funds that comprise the index managed $14.9 billion in net assets and represent 43% of the foreign equity world large cap funds segment made of actively managed mutual funds and ETFs as of December 31, 2019.
[1] While definitions continue to evolve, sustainable investing refers to a range of five overarching investing approaches or strategies that encompass: values-based investing, negative screening (exclusions), thematic and impact investing, ESG integration and shareholder/bondholder engagement and proxy voting. These are not mutually exclusive.
Sustainableinvest.com
Benefits
Free access to regularly updated original research and analysis focused exclusively on sustainable finance and investing, providing investors with the guidance needed to make informed investment decisions that align with their personal values and financial goals while also contributing to the advancement of positive long-term environmental and social outcomes.
By offering financial support for our current work, either in the form of a one-time or regular contributions, you help to defray some of the costs associated with conducting our research and analysis as well as to maintain the www.sustainablest.wpengine.com website.
Helping us to expand our research capabilities and offerings over time to cover additional relevant topics geared to sustainable investors.
Sign up to free newsletters.
By submitting this form, you are consenting to receive marketing emails from: . You can revoke your consent to receive emails at any time by using the SafeUnsubscribe® link, found at the bottom of every email. Emails are serviced by Constant Contact