Major US stock indexes close the month of May down in excess of 6%, recording their worst monthly performance since December 2018
Major US stock indexes lost more than 1% on the last trading day of May to close the month down in excess of 6%, their first calendar month decline for the year and the worst monthly performance since December 2018. This was being attributed to shifting investor sentiment motivate by concerns that the decade-long US economic growth cycle may be coming to an end as companies curtail spending and higher tariffs around the world are expected to hurt sales and corporate earnings. The drop on Friday, the last trading day in May, came after President Trump, in a move that unnerved investors, announced plans via Twitter to impose tariffs on Mexico in a bid to compel the nation’s third largest trading partner to crack down on migrants attempting to enter the US. The S&P 500 gave up 6.35% in May, to close at a level of 2752.06–roughly in line with the benchmark’s value on March 8th. Following that date, the index reached a peak on April 30, and thereafter the S&P 500 recorded 14 daily declines (64%) during 22 trading days through the end of May. Refer to Chart 1. The Dow Jones Industrial Average posted a similar result in May, giving up -6.32% while the technology heavy NASDAQ Composite declined -7.79%. This was roughly in line with the performance of small company stocks that gave back -7.78%. In general, growth stocks across the market cap continuum delivered better results than value-oriented stocks. 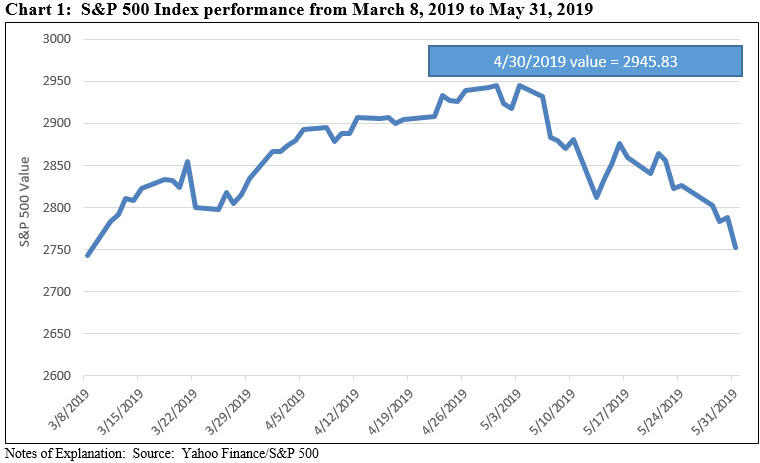 Investor unease during May cut across all but one S&P 500 sector, namely Real Estate, that eked out a positive 0.90% return. Otherwise, the ten remaining industry sectors experienced declines ranging from -1.28% recorded by Utilities to -11.70% generated by the Energy sector. Indeed, oil prices also fell sharply on the last trading day of May to their lowest level in more than three months as worries about trade policy and the slowdown in the Chinese economy cast doubt about the outlook for global demand. Adding to the gloom was disappointing manufacturing data in China which raised concerns that Beijing’s efforts to rejuvenate growth are faltering in the face of trade tensions with the US. Investor anxiety was also reflected across the bond market. The yield on 10-year Treasury notes fell sharply to 2.14%, down from 2.51% at the end of April 2019, and the lowest level since September 2017. Further, yields inverted on May 22nd as the 3-month Treasury yields reached 2.38% while the 10-year hit 2.39%. At the same time, prices of long-dated corporates, and in particular higher rated ones, as well as treasuries, were lifted. In fact, long dated treasuries recorded a gain of 6.7% while long-dated AAA rated corporate bonds were up 2.68%. Overseas, stocks declined -5.37% as measured by the MSCI ACWI Index. Emerging market stocks ended the month even lower, with China-based stocks producing a total return of -13.08%, due to escalating trade conflicts that also rippled through to emerging markets. Emerging-market stocks, based on the performance of the MSCI Emerging Markets Index, slipped into correction territory as the index gave up more than 10% from its peak value in April. The MSCI EAFE NR Index gave up -4.80%.
For the fourth month in a row, the Sustainable (SUSTAIN) Large Cap Equity Fund Index outperformed the S&P 500, beating the index by 75 basis points (bps)
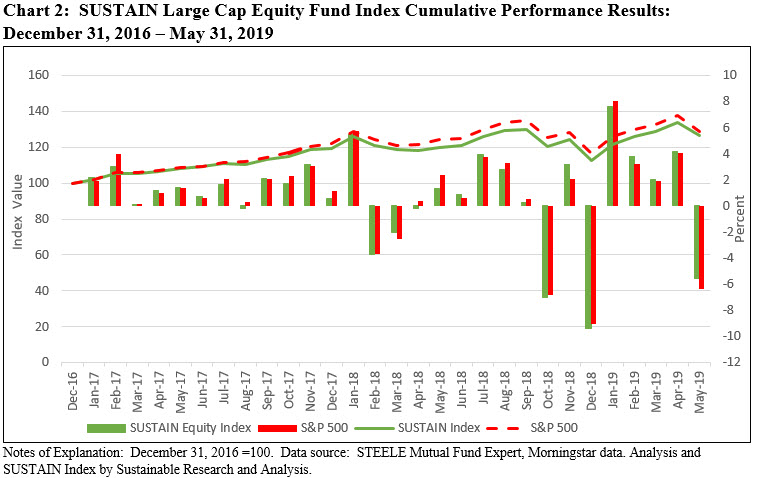
The Sustainable (SUSTAIN) Large Cap Equity Fund Index posted a decline of -5.6%, besting the S&P 500 by 75 basis points as seven of the ten sustainable index constituents beat the conventional benchmark. This was the fourth month in a row that the SUSTAIN Index exceeded the performance of the S&P 500 and represents the longest such record since the commencement of the index as of December 31, 2017. Refer to Table 1 and Chart 2. The leading funds included the $2.7 billion Calvert Equity A, down -2.81%, exceeding the S&P 500 by 3.54%. The fund is managed by Calvert Investment Management and sub-advised by Atlanta Capital Management (a majority-owned independent subsidiary of Eaton Vance Corp.), employs a combination of strategies, including negative screening, impact investing, ESG integration as well as shareholder engagement strategies. The same fund is up 27.88% year-to-date and 18.8% for the previous 12 months, exceeding the performance of the next best index member, the Parnassus Core Equity Investor Fund by 7.96%. The $16.4 billion Parnassus Core Equity Investor Fund, which likewise employs a combination of strategies, including negative screening, impact investing, ESG integration as well as shareholder engagement strategies, was also the second best performer in May, down -4.47%. At the other end of the range, last month’s second best performer, the $627.2 million Pax Large Cap Fund Institutional Shares, returned -6.96%. The fund also trails the S&P 500 over the latest 3-month, year-to-date and trailing 12-month intervals. 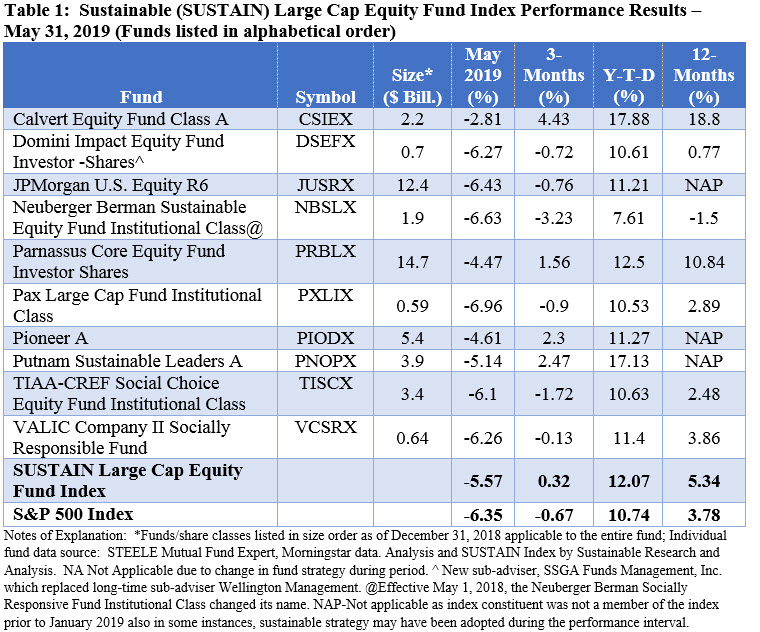
The Sustainable (SUSTAIN) Bond Fund Index posted a strong gain of 1.74%, but slightly lags behind the Bloomberg Barclays US Aggregated Index that was up 1.78%
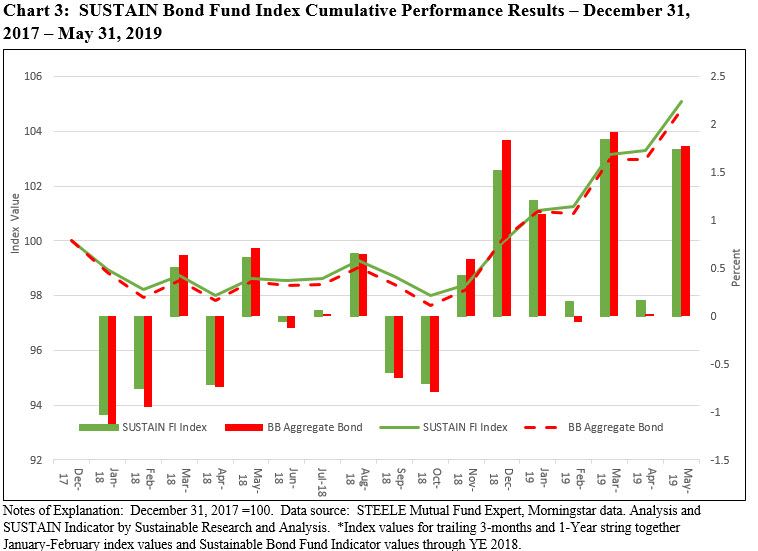
The Sustainable (SUSTAIN) Bond Fund Index posted a strong gain of 1.74%, the third best index performance since the start of last year (2018) when the benchmark was initiated. But this was just slightly below the total return performance of the Bloomberg Barclays US Aggregate Index that was up 1.78% as only two of the ten index members bested the conventional index. Refer to Table 2 and Chart 3. These funds included the $288.7 million Touchstone Impact Bond Institutional Fund, managed by EARNEST Partners LLC, up 2.04%, and the $212.8 million Parnassus Fixed Income, up 1.84%. Both funds benefited from average maturities in excess of the 7.79 years maintained by the Bloomberg Barclays Aggregate US Index and a single A average credit quality. Funds at the lower end of the performance range, such as Calvert Bond A, reported lower weighted average maturities relative to the conventional benchmark and a lower average credit quality. For example, the $1,515.2 million Calvert Bond A, up 1.62% in May reported an average credit quality of BBB and a weighted average maturity of 5.77 years. Still, in a month when only 10.4% of sustainable funds, both equity and bond funds, recorded gains ≥ than 1%, all ten SUSTAIN Index fund members posted gains in excess of 1.62%. 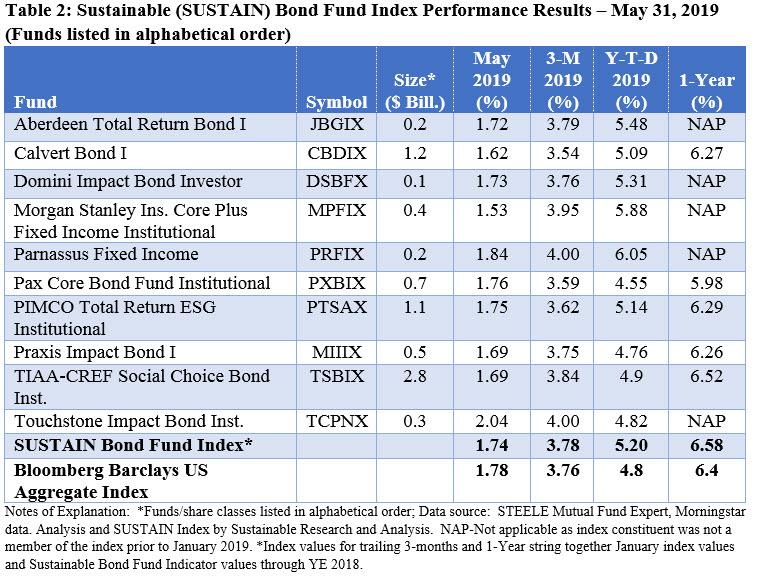
May 2019 performance of various ESG indices versus conventional indices
The chart below (refer to Chart 4) displays the performance in May of selected sustainable securities market and fund indices versus their conventional counterparts. Two comparisons in particular stand out. The first is the performance differential in May between the SUSTAIN Large Cap Equity Fund Index that outperformed both the conventional S&P 500 Index and the S&P 500 ESG Index by 78 bps and 63 bps, respectively. The second is the 74 bps performance differential between the MSCI Emerging Markets ESG Index and it conventional counterpart. 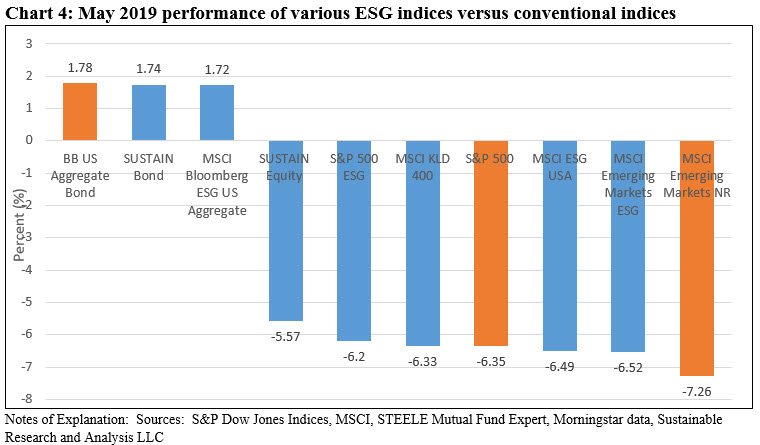
SUSTAIN Large Cap Equity Index Gives Up -5.6% in May; Bond Funds Gain 1.74%
Major US stock indexes lost more than 1% on the last trading day of May to close the month down in excess of 6%, their first calendar month decline for the year and the worst monthly performance since December 2018. This was being attributed to shifting investor sentiment motivate by concerns that the decade-long US…
Share This Article:
Major US stock indexes close the month of May down in excess of 6%, recording their worst monthly performance since December 2018
Major US stock indexes lost more than 1% on the last trading day of May to close the month down in excess of 6%, their first calendar month decline for the year and the worst monthly performance since December 2018. This was being attributed to shifting investor sentiment motivate by concerns that the decade-long US economic growth cycle may be coming to an end as companies curtail spending and higher tariffs around the world are expected to hurt sales and corporate earnings. The drop on Friday, the last trading day in May, came after President Trump, in a move that unnerved investors, announced plans via Twitter to impose tariffs on Mexico in a bid to compel the nation’s third largest trading partner to crack down on migrants attempting to enter the US. The S&P 500 gave up 6.35% in May, to close at a level of 2752.06–roughly in line with the benchmark’s value on March 8th. Following that date, the index reached a peak on April 30, and thereafter the S&P 500 recorded 14 daily declines (64%) during 22 trading days through the end of May. Refer to Chart 1. The Dow Jones Industrial Average posted a similar result in May, giving up -6.32% while the technology heavy NASDAQ Composite declined -7.79%. This was roughly in line with the performance of small company stocks that gave back -7.78%. In general, growth stocks across the market cap continuum delivered better results than value-oriented stocks. Investor unease during May cut across all but one S&P 500 sector, namely Real Estate, that eked out a positive 0.90% return. Otherwise, the ten remaining industry sectors experienced declines ranging from -1.28% recorded by Utilities to -11.70% generated by the Energy sector. Indeed, oil prices also fell sharply on the last trading day of May to their lowest level in more than three months as worries about trade policy and the slowdown in the Chinese economy cast doubt about the outlook for global demand. Adding to the gloom was disappointing manufacturing data in China which raised concerns that Beijing’s efforts to rejuvenate growth are faltering in the face of trade tensions with the US. Investor anxiety was also reflected across the bond market. The yield on 10-year Treasury notes fell sharply to 2.14%, down from 2.51% at the end of April 2019, and the lowest level since September 2017. Further, yields inverted on May 22nd as the 3-month Treasury yields reached 2.38% while the 10-year hit 2.39%. At the same time, prices of long-dated corporates, and in particular higher rated ones, as well as treasuries, were lifted. In fact, long dated treasuries recorded a gain of 6.7% while long-dated AAA rated corporate bonds were up 2.68%. Overseas, stocks declined -5.37% as measured by the MSCI ACWI Index. Emerging market stocks ended the month even lower, with China-based stocks producing a total return of -13.08%, due to escalating trade conflicts that also rippled through to emerging markets. Emerging-market stocks, based on the performance of the MSCI Emerging Markets Index, slipped into correction territory as the index gave up more than 10% from its peak value in April. The MSCI EAFE NR Index gave up -4.80%.
For the fourth month in a row, the Sustainable (SUSTAIN) Large Cap Equity Fund Index outperformed the S&P 500, beating the index by 75 basis points (bps)
The Sustainable (SUSTAIN) Large Cap Equity Fund Index posted a decline of -5.6%, besting the S&P 500 by 75 basis points as seven of the ten sustainable index constituents beat the conventional benchmark. This was the fourth month in a row that the SUSTAIN Index exceeded the performance of the S&P 500 and represents the longest such record since the commencement of the index as of December 31, 2017. Refer to Table 1 and Chart 2. The leading funds included the $2.7 billion Calvert Equity A, down -2.81%, exceeding the S&P 500 by 3.54%. The fund is managed by Calvert Investment Management and sub-advised by Atlanta Capital Management (a majority-owned independent subsidiary of Eaton Vance Corp.), employs a combination of strategies, including negative screening, impact investing, ESG integration as well as shareholder engagement strategies. The same fund is up 27.88% year-to-date and 18.8% for the previous 12 months, exceeding the performance of the next best index member, the Parnassus Core Equity Investor Fund by 7.96%. The $16.4 billion Parnassus Core Equity Investor Fund, which likewise employs a combination of strategies, including negative screening, impact investing, ESG integration as well as shareholder engagement strategies, was also the second best performer in May, down -4.47%. At the other end of the range, last month’s second best performer, the $627.2 million Pax Large Cap Fund Institutional Shares, returned -6.96%. The fund also trails the S&P 500 over the latest 3-month, year-to-date and trailing 12-month intervals.

The Sustainable (SUSTAIN) Bond Fund Index posted a strong gain of 1.74%, but slightly lags behind the Bloomberg Barclays US Aggregated Index that was up 1.78%
The Sustainable (SUSTAIN) Bond Fund Index posted a strong gain of 1.74%, the third best index performance since the start of last year (2018) when the benchmark was initiated. But this was just slightly below the total return performance of the Bloomberg Barclays US Aggregate Index that was up 1.78% as only two of the ten index members bested the conventional index. Refer to Table 2 and Chart 3. These funds included the $288.7 million Touchstone Impact Bond Institutional Fund, managed by EARNEST Partners LLC, up 2.04%, and the $212.8 million Parnassus Fixed Income, up 1.84%. Both funds benefited from average maturities in excess of the 7.79 years maintained by the Bloomberg Barclays Aggregate US Index and a single A average credit quality. Funds at the lower end of the performance range, such as Calvert Bond A, reported lower weighted average maturities relative to the conventional benchmark and a lower average credit quality. For example, the $1,515.2 million Calvert Bond A, up 1.62% in May reported an average credit quality of BBB and a weighted average maturity of 5.77 years. Still, in a month when only 10.4% of sustainable funds, both equity and bond funds, recorded gains ≥ than 1%, all ten SUSTAIN Index fund members posted gains in excess of 1.62%.

May 2019 performance of various ESG indices versus conventional indices
The chart below (refer to Chart 4) displays the performance in May of selected sustainable securities market and fund indices versus their conventional counterparts. Two comparisons in particular stand out. The first is the performance differential in May between the SUSTAIN Large Cap Equity Fund Index that outperformed both the conventional S&P 500 Index and the S&P 500 ESG Index by 78 bps and 63 bps, respectively. The second is the 74 bps performance differential between the MSCI Emerging Markets ESG Index and it conventional counterpart.
Sustainableinvest.com
Benefits
Free access to regularly updated original research and analysis focused exclusively on sustainable finance and investing, providing investors with the guidance needed to make informed investment decisions that align with their personal values and financial goals while also contributing to the advancement of positive long-term environmental and social outcomes.
By offering financial support for our current work, either in the form of a one-time or regular contributions, you help to defray some of the costs associated with conducting our research and analysis as well as to maintain the www.sustainablest.wpengine.com website.
Helping us to expand our research capabilities and offerings over time to cover additional relevant topics geared to sustainable investors.
Sign up to free newsletters.
By submitting this form, you are consenting to receive marketing emails from: . You can revoke your consent to receive emails at any time by using the SafeUnsubscribe® link, found at the bottom of every email. Emails are serviced by Constant Contact