Summary
The SUSTAIN Large Cap Equity Fund Index, which tracks the total return performance of the ten largest actively managed large cap US oriented equity mutual funds that employ a sustainable investing strategy beyond absolute reliance on exclusionary practices, posted a strong gain of 5.47% in January and 23.05% for the twelve month period to January 31, 2018. Still, the SUSTAIN Index lagged the S&P 500 by 26 basis points (bps) and 236 bps in January and trailing 12-months, respectively, as the non-ESG index posted even stronger results ahead of a market correction that took place in early February 2018.
SUSTAIN Index Posts Strong 5.47% Gain but Lags S&P 500 Index
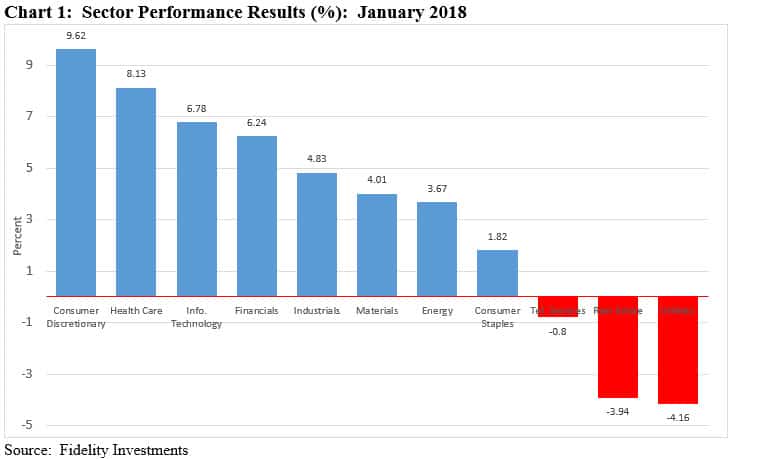
The SUSTAIN Large Cap Equity Fund Index, which tracks the total return performance of the ten largest actively managed large cap US oriented equity mutual funds that employ a sustainable investing strategy beyond absolute reliance on exclusionary practices, posted a strong 5.47% total return in January but lagged the S&P 500 Index by 26 bps. Yet, this was the best result achieved by the SUSTAIN Index since calculations were initiated as of January 2017. Five funds exceeded the performance of the index itself while 4 funds eclipsed the gain achieved by the S&P 500, which delivered a total return of 5.73% in January. This was the best monthly gain for the S&P 500 since March 2016, when it recorded an increase of 6.78%, even after stocks tumbled on the next to last trading day of the month and gave up some 1.01%. (Note: The stock market’s correction in February reversed these gains). Up to January 30, the S&P had notched 14 record closes over the course of the month. The stock market continued to benefit from investor expectations for continued economic growth in the US and abroad and higher corporate earnings bolstered by the passage of the Tax Cuts and Jobs Act of 2017. Strong performance, on average, was posted by stocks in the Consumer Discretionary (+9.62%) and Health Care (+8.13%) sectors in particular while Utilities (-4.16%), Real Estate (-3.94%) and Telecommunications Services (-0.80%) declined. Refer to Chart 1.

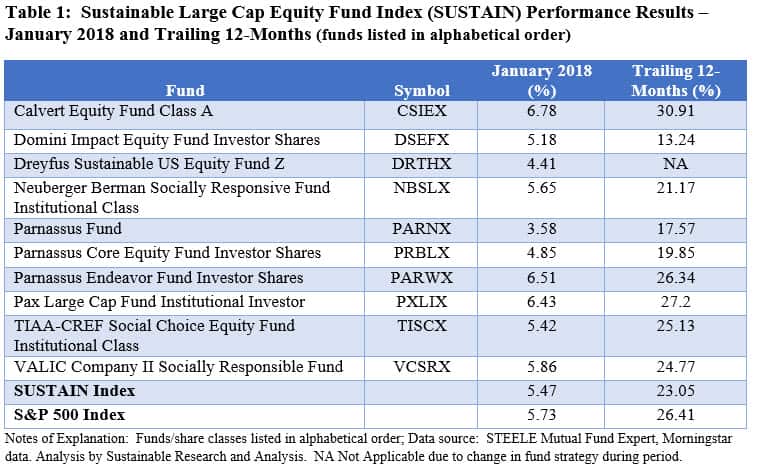
Calvert Equity A, which was the best performing SUSTAIN Index member in 2017 with a 25.79% total return continued to lead the pack. The fund registered a gain of 6.78%, benefiting from its growth tilt and holdings in the strong January performing Technology and Health Care sectors, including heavily weighted names like Alphabet Inc. C, Microsoft Corp. and Danaher Corp, that together accounted for about 45% of portfolio assets (as of 12/31/2017). At the same time, the fund was not dragged down by exposures to Utilities and Real Estate, two sectors that posted negative monthly average returns. Parnassus Endeavor Fund Investor Shares and Pax Large Cap Fund Institutional also performed well, posting returns of 6.51% and 6.43%, respectively.
Bringing in the rear was the Parnassus Fund, posting a 3.58% gain. The fund’s performance was restrained by the lowering of its exposure to the technology sector and above benchmark positioning relative to real estate which gave up 3.94% during the month of January. At the same time, the fund’s avoidance of the utility sector contributed positively as the sector declined in concert with rising interest rates, with 10-year Treasuries gaining 32 bps, and inflation concerns. Behind Parnassus were Dreyfus Sustainable US Equity and Domini Impact Equity Investor with returns of 4.41% and 5.18%, respectively. Refer to Table 1.

SUSTAIN Index gained 23.05% During the Trailing 12-Month while the S&P 500 Added 26.41%
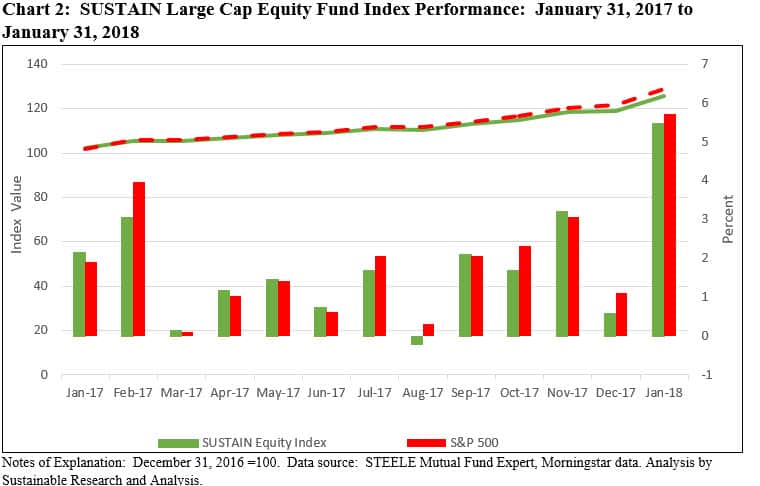
For the trailing 12-month period through January 31, 2018, the SUSTAIN Index gained 23.05% versus an increase of 26.41% recorded by the S&P 500, for a widening difference of 236 bps. Calvert Equity A led with a total return of 30.91% followed by Pax Large Cap Fund Institutional that gained 27.2%. At the other end of the range were Domini Impact Equity Investor and Parnassus Fund, with below benchmark gains of 13.24% and 17.57%. Refer to Chart 2.

The Sustainable Large Cap Equity Fund Index (SUSTAIN Index) Explained
The index, which was initiated as of June 30, 2017 with data back to December 30, 2016, tracks the total return performance of the ten largest actively managed large cap domestic equity mutual funds that employ a sustainable investing strategy beyond absolute reliance on exclusionary practices for religious, ethical or social reasons. While methodologies vary, to qualify for inclusion in the index, funds must actively apply environmental, social and governance (ESG) criteria to their investment processes and decision making. In tandem with their ESG integration strategy, funds may also employ exclusionary strategies along with impact-oriented investment approaches as well as shareholder advocacy.
The SUSTAIN Index was reconstituted following the close of business on September 31, 2017 with the deletion of the Sentinel Sustainable Core Opportunities Fund Class A and the addition of the Dreyfus Sustainable US Equity Fund Z in advance of the October 30, 2017 completion of the sale of Sentinel mutual funds to Touchstone Investments. In the process, the Sentinel Sustainable Core Opportunities Fund was reorganized into the existing Touchstone Sustainability and Impact Equity Fund that pursues an expanded global investment strategy, including developed and developing countries.
Multiple funds managed by the same management firm may be included in the index, however, a fund with multiple share classes is only included in the index once, based on the largest share class in terms of assets. The index is equally weighted, it is calculated monthly and generally rebalanced once a year as of December 31.
The combined assets associated with the ten funds stood at $21.7 billion and represent about 12.2% of the entire sustainable US equity sector that is comprised of 256 funds/share classes, including actively managed funds and index funds, with $178.3 billion in assets under management[1] as of December 30, 2017.
[1] With all share classes combined, total net assets=$32.6 billion or 18.3% of the sustainable US equity mutual funds sector.
SUSTAIN Large Cap Equity Fund Index Posts Strong 5.47% Gain in January 2018
Summary
Share This Article:
Summary
The SUSTAIN Large Cap Equity Fund Index, which tracks the total return performance of the ten largest actively managed large cap US oriented equity mutual funds that employ a sustainable investing strategy beyond absolute reliance on exclusionary practices, posted a strong gain of 5.47% in January and 23.05% for the twelve month period to January 31, 2018. Still, the SUSTAIN Index lagged the S&P 500 by 26 basis points (bps) and 236 bps in January and trailing 12-months, respectively, as the non-ESG index posted even stronger results ahead of a market correction that took place in early February 2018.
SUSTAIN Index Posts Strong 5.47% Gain but Lags S&P 500 Index
The SUSTAIN Large Cap Equity Fund Index, which tracks the total return performance of the ten largest actively managed large cap US oriented equity mutual funds that employ a sustainable investing strategy beyond absolute reliance on exclusionary practices, posted a strong 5.47% total return in January but lagged the S&P 500 Index by 26 bps. Yet, this was the best result achieved by the SUSTAIN Index since calculations were initiated as of January 2017. Five funds exceeded the performance of the index itself while 4 funds eclipsed the gain achieved by the S&P 500, which delivered a total return of 5.73% in January. This was the best monthly gain for the S&P 500 since March 2016, when it recorded an increase of 6.78%, even after stocks tumbled on the next to last trading day of the month and gave up some 1.01%. (Note: The stock market’s correction in February reversed these gains). Up to January 30, the S&P had notched 14 record closes over the course of the month. The stock market continued to benefit from investor expectations for continued economic growth in the US and abroad and higher corporate earnings bolstered by the passage of the Tax Cuts and Jobs Act of 2017. Strong performance, on average, was posted by stocks in the Consumer Discretionary (+9.62%) and Health Care (+8.13%) sectors in particular while Utilities (-4.16%), Real Estate (-3.94%) and Telecommunications Services (-0.80%) declined. Refer to Chart 1.
Calvert Equity A, which was the best performing SUSTAIN Index member in 2017 with a 25.79% total return continued to lead the pack. The fund registered a gain of 6.78%, benefiting from its growth tilt and holdings in the strong January performing Technology and Health Care sectors, including heavily weighted names like Alphabet Inc. C, Microsoft Corp. and Danaher Corp, that together accounted for about 45% of portfolio assets (as of 12/31/2017). At the same time, the fund was not dragged down by exposures to Utilities and Real Estate, two sectors that posted negative monthly average returns. Parnassus Endeavor Fund Investor Shares and Pax Large Cap Fund Institutional also performed well, posting returns of 6.51% and 6.43%, respectively.
Bringing in the rear was the Parnassus Fund, posting a 3.58% gain. The fund’s performance was restrained by the lowering of its exposure to the technology sector and above benchmark positioning relative to real estate which gave up 3.94% during the month of January. At the same time, the fund’s avoidance of the utility sector contributed positively as the sector declined in concert with rising interest rates, with 10-year Treasuries gaining 32 bps, and inflation concerns. Behind Parnassus were Dreyfus Sustainable US Equity and Domini Impact Equity Investor with returns of 4.41% and 5.18%, respectively. Refer to Table 1.
SUSTAIN Index gained 23.05% During the Trailing 12-Month while the S&P 500 Added 26.41%
For the trailing 12-month period through January 31, 2018, the SUSTAIN Index gained 23.05% versus an increase of 26.41% recorded by the S&P 500, for a widening difference of 236 bps. Calvert Equity A led with a total return of 30.91% followed by Pax Large Cap Fund Institutional that gained 27.2%. At the other end of the range were Domini Impact Equity Investor and Parnassus Fund, with below benchmark gains of 13.24% and 17.57%. Refer to Chart 2.
The Sustainable Large Cap Equity Fund Index (SUSTAIN Index) Explained
The index, which was initiated as of June 30, 2017 with data back to December 30, 2016, tracks the total return performance of the ten largest actively managed large cap domestic equity mutual funds that employ a sustainable investing strategy beyond absolute reliance on exclusionary practices for religious, ethical or social reasons. While methodologies vary, to qualify for inclusion in the index, funds must actively apply environmental, social and governance (ESG) criteria to their investment processes and decision making. In tandem with their ESG integration strategy, funds may also employ exclusionary strategies along with impact-oriented investment approaches as well as shareholder advocacy.
The SUSTAIN Index was reconstituted following the close of business on September 31, 2017 with the deletion of the Sentinel Sustainable Core Opportunities Fund Class A and the addition of the Dreyfus Sustainable US Equity Fund Z in advance of the October 30, 2017 completion of the sale of Sentinel mutual funds to Touchstone Investments. In the process, the Sentinel Sustainable Core Opportunities Fund was reorganized into the existing Touchstone Sustainability and Impact Equity Fund that pursues an expanded global investment strategy, including developed and developing countries.
Multiple funds managed by the same management firm may be included in the index, however, a fund with multiple share classes is only included in the index once, based on the largest share class in terms of assets. The index is equally weighted, it is calculated monthly and generally rebalanced once a year as of December 31.
The combined assets associated with the ten funds stood at $21.7 billion and represent about 12.2% of the entire sustainable US equity sector that is comprised of 256 funds/share classes, including actively managed funds and index funds, with $178.3 billion in assets under management[1] as of December 30, 2017.
[1] With all share classes combined, total net assets=$32.6 billion or 18.3% of the sustainable US equity mutual funds sector.
Sustainableinvest.com
Benefits
Free access to regularly updated original research and analysis focused exclusively on sustainable finance and investing, providing investors with the guidance needed to make informed investment decisions that align with their personal values and financial goals while also contributing to the advancement of positive long-term environmental and social outcomes.
By offering financial support for our current work, either in the form of a one-time or regular contributions, you help to defray some of the costs associated with conducting our research and analysis as well as to maintain the www.sustainablest.wpengine.com website.
Helping us to expand our research capabilities and offerings over time to cover additional relevant topics geared to sustainable investors.
Sign up to free newsletters.
By submitting this form, you are consenting to receive marketing emails from: . You can revoke your consent to receive emails at any time by using the SafeUnsubscribe® link, found at the bottom of every email. Emails are serviced by Constant Contact