Global markets across all major asset classes posted gains in June.
Global markets across all major asset classes posted gains in June. Notwithstanding trade concerns and fears of an economic slowdown, stocks and bonds in the US and overseas recovered from May’s declines to produce strong returns in June, ranging from a low of -0.27% posted by the MSCI India (NR) Index to highs of 12% or so for energy and biotechnology stocks (some commodities aside) and lift second quarter and year-to-date results. The S&P 500 Index, which gained 7.05% in June versus a decline of -6.35% the month prior, also advanced the three-month total return results to 4.30% and the year-to-date increase to 18.54% thanks, in part, to a perceived shift in the Federal Reserve Banks’ ‘s appetite for interest-rate cuts. In early June Federal Reserve Chairman Jerome Powell addressed the fears of how the continuing trade squabble with China could hurt the economy, saying the central bank was closely monitoring the escalation in tensions and indicating it could respond by cutting rates if the economic outlook deteriorated. Investors reacted positively to the news, extending a rally that propelled the S&P 500 to record highs. The Dow Jones Industrial Average gained 7.31% while the tech heavy Nasdaq Composite added 7.51% and shares of smaller companies, based on the Russell 2000 Index, posted results more or less in line with large caps with an increase of 7.07%. However, small companies lagged for the quarter and year-to-date intervals with gains of 2.10% and 16.98%, respectively. Over the trailing twelve months, small caps recorded a decline of -3.31%, an indication that may have reflected fears that the U.S. economy’s growth is cooling. Value stocks exceeded the performance of growth stocks across the market capitalization range from large cap to small caps. Sustainable mutual funds and ETFs, across all asset categories, gained an average of 5.08%.
Mounting fears of an economic slowdown served to push bond yields down globally and bond prices higher, contributing to the 1.26% June uptick in the Bloomberg Barclays US Aggregate Index. The yield on the 10-year U.S. Treasury closed the quarter at 2%, nearly a half-percentage-point drop from the end of March, a downward roll that took many investors by surprise. That said, the economy in the US, which has been expanding for an unprecedented 10 years, is sending mixed signals and its persistence is unclear. Consumers continue to spend, as confirmed at the end of the month by the Commerce Department’s report that consumption spending rose a healthy 0.4% in May, however, wage and salary income growth and the average hourly wages are not ratcheting up. At the same time, American businesses are sounding a more pessimistic note, as trade was and the fading impact of the 2017 tax cut are holding back business investments. These considerations are worrisome for any forecasts regarding the continued growth for the U.S. economy.
Outside the US, share prices also rose. The MSCI All Country World Index, ex US (NR) gained 6.02% in June and stands 13.60% higher since the start of the year. In Europe, stocks responded to hints of further monetary easing made by Mario Draghi, the European Central Bank President, who also called for a common Eurozone budget as an additional economic shock absorber. In China, notwithstanding trade tensions and signs that China’s economy may be slowing, the MSCI China (NR) Index was up 8.03%.
The Sustainable (SUSTAIN) Large Cap Equity Fund Index posted a strong gain of 6.79% but lagged the S&P 500 by 25 basis points (bps)
Following four months of outperformance, the Sustainable (SUSTAIN) Large Cap Equity Fund Index posted a strong gain of 6.79% but lagged the S&P 500 by 25 basis points (bps). While this was the best increase for the index since adding 7.65% in January, the SUSTAIN Index was hampered by the performance of eight index members that fell behind the conventional large cap benchmark with results ranging from 5.87% to 7.0%. Only two sustainable large cap funds managed to outperform the S&P 500. These included the Pax Large Cap Fund Institutional Shares, up 7.44%, and Domini Impact Equity Investor, up 7.14%. Refer to Table 1.
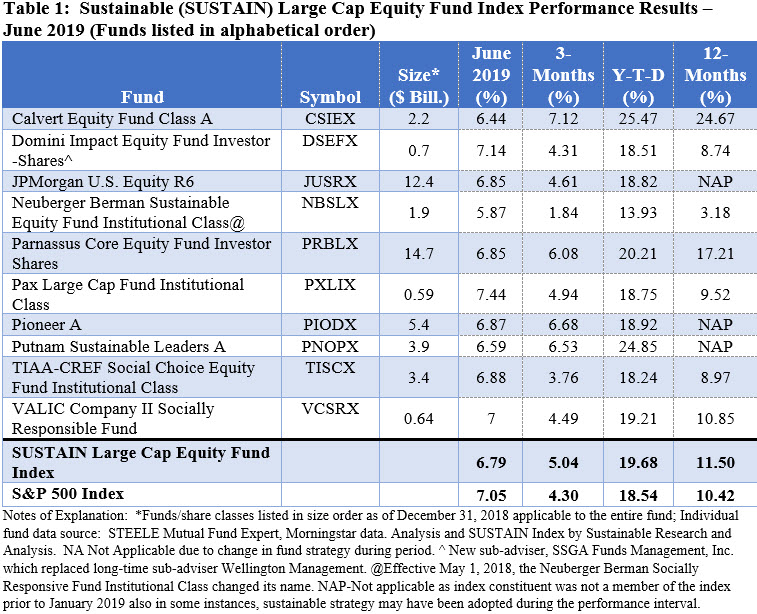
The $673.9 million Pax Large Cap Fund, with an asset base comprised almost entirely of institutional investors, maintained sector allocations largely in line with the S&P 500 Index, excepting its zero weighting in the Utility sector which recorded a slight but positive result in June with a gain of 0.38%. The fund was buoyed by its small 2.28% cash position but, even more importantly, the fund’s performance was lifted by the large and overweight exposures to firms such as Apple (AAPL) and Microsoft (MSFT) that in June gained 13.05% and 8.31%, respectively.
The second best performing fund, the $760 million Domini Impact Equity Investor Shares, benefited from a fully invested position (0.31% cash as of March 31, 2019) and 10% overweight exposure to technology stocks, 33% versus 23% for the S&P 500. At the same time, the Neuberger Berman Sustainable Equity Institutional Fund, which brought up the rear in 10th position with a still most respectable one-month 5.87% return, was hampered by the fund’s 14.38% investments in non-US stocks and, in particular, European stocks in developed markets, given that MSCI EAFE (NR) lagged the S&P 500 by 1.12%.
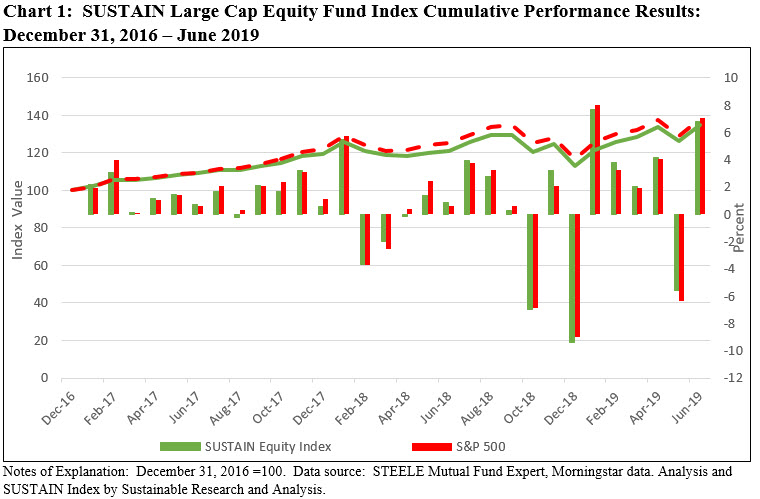
Since its inception as of December 31, 2016, or a period of 2.5 years, the SUSTAIN Large Cap Equity Fund Index trails the S&P 500 by 2.74% through the end of June. Refer to Chart 1.
The Sustainable (SUSTAIN) Bond Fund Index also trailed the conventional Bloomberg Barclays US Aggregate Index in June, posting a strong gain of 1.22% versus 1.26%
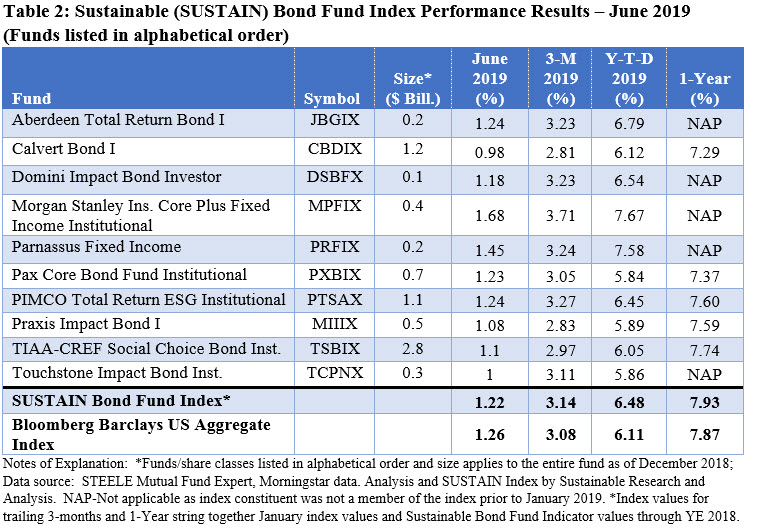
The Sustainable (SUSTAIN) Bond Fund Index also trailed the conventional Bloomberg Barclays US Aggregate Index in June, posting a strong gain of 1.22% versus 1.26% for the Bloomberg benchmark, for a slight 4 bps differential. Still, this was the fourth month this year during which the SUSTAIN Bond Fund Index recorded gains in excess of 1%. This brings the 3-month total return to 3.14% as compared to 3.08% attributable to the Bloomberg index. Sustainable bond funds also lead on a year-to-date basis as well as trailing twelve months.
This was the second consecutive month of underperformance for the SUSTAIN Bond Fund Index, as eight of the 10 index members recorded gains below 1.26%, with all but one fund, Calvert Bond I, posting a one-month gain excess of 1%. Two funds excelled, including the $464.8 million Morgan Stanley Institutional Core Plus Fixed Income Fund, up 1.68%, and the Parnassus Fixed Income Fund, up 1.45%. The Morgan Stanley fund, which incorporates, as part of the investment process, information about environmental, social and governance issues while the management company may also engage with management of certain issuers regarding corporate governance practices as well as what the fund’s adviser deems to be materially important environmental and/or social issues facing a company, benefited from investments in lower rated bonds, including non-investment-grade and non-rated securities, that outperformed investment-grade instruments in June. The higher “A” average credit quality of the smaller $220.6 million Parnassus Fixed Income Fund that employs a broader sustainable investing strategy that includes ESG integration but also extends to exclusions, impact investing as well as engagement with company managements, was lifted, it seems, by its longer average effective maturity which stood at 8.11 years versus 7.76 years for the Bloomberg benchmark. Refer to Table 2.
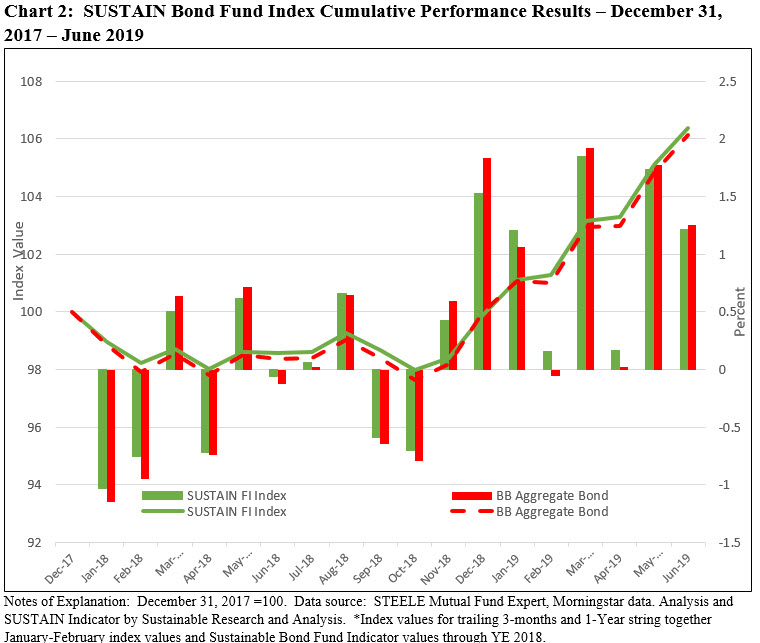
Since its inception as of December 31, 2017 through the end of June, or a period of 1.5 years, the SUSTAIN Bond Fund Index continues to outperform the Bloomberg Barclays US Aggregate Index by 25 bps. Refer to Chart 2.
Launch of the Sustainable (SUSTAIN) Foreign Equity Fund Index
The substantial growth over the last year in both the number and assets under management sourced to similarly managed sustainable international mutual funds in general and foreign funds, in particular, has made it possible to create a sustainable mutual fund index that tracks the performance of funds within one or more segments of this market segment. Just in the last 24 months, international funds, including mutual funds and ETFs, expanded from 151 funds/share classes with $15.4 billion in assets under management to 593 funds/share classes and $99.8 billion in assets under management, or almost a seven-fold increase. In large part, this increase is due to the rebranding of existing funds that have adopted sustainable investing strategies, mainly in the form of ESG integration. While this segment is comprised of various investment themes or objectives, ranging from country-specific focused funds, such as Japan oriented stock funds, to emerging market funds, the largest segment, with $44.5 billion in assets of 44.6% of the segment’s total net assets as of June 2019, is sourced to large cap growth, value and hybrid funds that (a) invest in foreign securities, excluding the US, (b) compare themselves to the performance of the MSCI All Country World, ex US Index which represents either the fund’s primary prospectus benchmark or has been determined to track the benchmark based on an analysis of the fund’s style composition (MPT), and (3) are employing a sustainable investing strategy that extends beyond strictly applying exclusionary criteria. The MSCI ACWI ex USA Index captures large and mid-cap companies across 22 of 23 developed markets countries (excluding the US) and 26 emerging markets countries. With 2,206 constituents as of June 2019, the index covers approximately 85% of the global equity opportunity set outside the US. For more details regarding the recent growth in the sustainable foreign mutual funds and ETFs segment, refer to a soon to be published article on this topic.
Launched with an effective date as of June 30, 2019, the Sustainable (SUSTAIN) Foreign Equity Fund Index, like the SUSTAIN Large Cap Equity Fund Index and the SUSTAIN Bond Fund Index, tracks the ten largest funds/share classes that make up the segment while also employing a sustainable investing strategy that extends beyond strictly applying exclusionary criteria. In total, these funds manage $14.6 billion in net assets and represent 32.8% of the segment’s assets under management at the end of June. Refer to the index description appended at the end of the article.
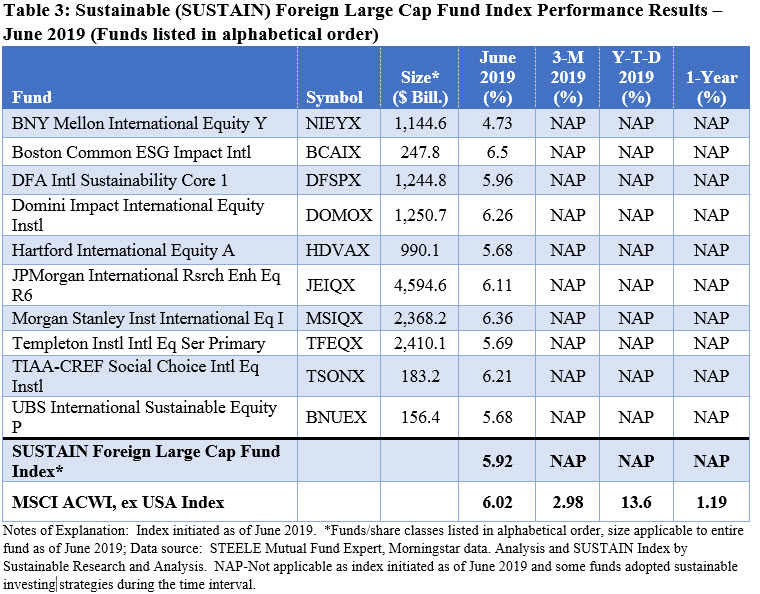
In its inaugural month of June, the index posted a gain of 5.92% versus 6.02% recorded by the MSCI ACWI, ex US, or a differential of 10 basis points. Five of the ten funds that make up the index added to performance with total returns ranging from 6.11% to a high of 6.5% generated by the $247.8 million Boston Common ESG Impact International. At the other end of the range, five funds detracted from June’s performance with results ranging from 4.73% to 5.96%. Refer to Table 3.
The Boston Common ESG Impact International Fund, managed by Boston Common Asset Management, LLC seeks to achieve long-term capital appreciation by investing at least 80% of its net assets in the securities of non U.S. companies, usually companies that have market capitalizations of $2 billion or greater, that meet the Boston Company’s ESG criteria. Up to 10% of the fund’s total assets may be invested in securities of companies located in emerging markets. As of March 31, 2019, the fund’s assets were largely allocated to developed markets with a small 5.86% sleeve allocated to emerging markets. The fund was underweighted in consumer defensive, consumer cyclical and technology stocks and over-weighted in financial services. In June, the fund benefited from its growth orientation.
Boston Common seeks companies with sound governance and histories of responsible financial management that it believes are capable of consistent, visible profitability over a long time horizon. The firm integrates financial and environmental, social, and governance (“ESG”) criteria into its stock selection process, believing that markets typically misvalue the risks and opportunities presented by ESG factors, both in terms of the timing and the magnitude of outcomes. Boston Common also believes that shareowner engagement plays a critically important role in raising the sustainability profile of our portfolios and empowers company management to be long-term in its focus. For further details regarding the fund’s ESG and engagement strategies, click on the Funds Directory tab.
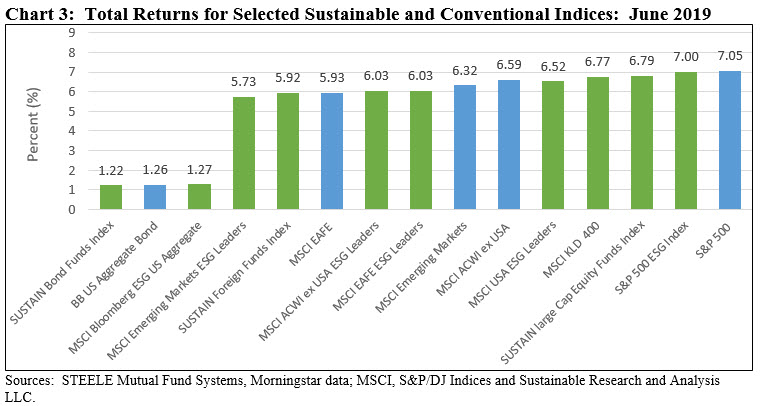
Performance of ESG indices versus non-ESG Indices: Clear wins in June for the S&P 500 conventional index and ESG fixed income
US Equities-The conventional S&P 500 Index led all ESG equity counterparts.
Fixed Income-The MSCI Bloomberg ESG US Aggregate Index led for the month of June by a margin of at least 1 basis point.
Foreign Equities-The conventional MSCI ACWI, ex USA and the MSCI Emerging Markets Index led its non-ESG counterparts while at the same time MSCI EAFE ESG Leaders Index led in its category.
Refer to Chart 3.
Sustainable (SUSTAIN) Foreign Equity Fund Index Explained
The index, which was initiated as of June 30, 2019 with data starting in June 2019, tracks the total return performance of the ten largest actively managed foreign equity mutual funds that employ a sustainable investing strategy beyond absolute reliance on exclusionary practices for religious, ethical or social reasons. While methodologies vary, to qualify for inclusion in the index, funds in excess of $50 million in net assets must actively apply environmental, social and governance (ESG) criteria to their investment processes and decision making. In tandem with their ESG integration strategy, funds may also employ exclusionary strategies along with impact-oriented investment approaches as well as shareholder advocacy.
Eligible foreign mutual funds are selected from the universe of foreign funds that align themselves to the performance of the MSCI All Country World, ex US Index. The index represents either fund’s primary prospectus benchmark or has been determined to track the benchmark based on an analysis of the fund’s style composition (MPT). The MSCI ACWI ex USA Index captures large and mid-cap companies across 22 of 23 developed markets countries (excluding the US) and 26 emerging markets countries. With 2,206 constituents as of June 2019, the index covers approximately 85% of the global equity opportunity set outside the US.
Only the largest single fund or share class managed by an investment management firm is included in the index. Also, a fund with multiple share classes is only included in the index once, based on the largest share class in terms of net assets. The index is equally weighted, it is calculated monthly and rebalanced once a year as of December 31.
The combined assets associated with the ten funds that comprise the index as of June 30, 2019 stood at $14.6 billion and represent about 32.8% of the $44.5 billion in assets sourced to large-cap growth, value and hybrid funds that invest in foreign securities, excluding the US.
SUSTAIN Indices Post Strong Results in June but Lag Conventional Benchmarks
Global markets across all major asset classes posted gains in June. Notwithstanding trade concerns and fears of an economic slowdown, stocks and bonds in the US and overseas recovered from May’s declines to produce strong returns in June, ranging from a low of -0.27% posted by the MSCI India (NR) Index to highs of 12%…
Share This Article:
Global markets across all major asset classes posted gains in June.
Global markets across all major asset classes posted gains in June. Notwithstanding trade concerns and fears of an economic slowdown, stocks and bonds in the US and overseas recovered from May’s declines to produce strong returns in June, ranging from a low of -0.27% posted by the MSCI India (NR) Index to highs of 12% or so for energy and biotechnology stocks (some commodities aside) and lift second quarter and year-to-date results. The S&P 500 Index, which gained 7.05% in June versus a decline of -6.35% the month prior, also advanced the three-month total return results to 4.30% and the year-to-date increase to 18.54% thanks, in part, to a perceived shift in the Federal Reserve Banks’ ‘s appetite for interest-rate cuts. In early June Federal Reserve Chairman Jerome Powell addressed the fears of how the continuing trade squabble with China could hurt the economy, saying the central bank was closely monitoring the escalation in tensions and indicating it could respond by cutting rates if the economic outlook deteriorated. Investors reacted positively to the news, extending a rally that propelled the S&P 500 to record highs. The Dow Jones Industrial Average gained 7.31% while the tech heavy Nasdaq Composite added 7.51% and shares of smaller companies, based on the Russell 2000 Index, posted results more or less in line with large caps with an increase of 7.07%. However, small companies lagged for the quarter and year-to-date intervals with gains of 2.10% and 16.98%, respectively. Over the trailing twelve months, small caps recorded a decline of -3.31%, an indication that may have reflected fears that the U.S. economy’s growth is cooling. Value stocks exceeded the performance of growth stocks across the market capitalization range from large cap to small caps. Sustainable mutual funds and ETFs, across all asset categories, gained an average of 5.08%.
Mounting fears of an economic slowdown served to push bond yields down globally and bond prices higher, contributing to the 1.26% June uptick in the Bloomberg Barclays US Aggregate Index. The yield on the 10-year U.S. Treasury closed the quarter at 2%, nearly a half-percentage-point drop from the end of March, a downward roll that took many investors by surprise. That said, the economy in the US, which has been expanding for an unprecedented 10 years, is sending mixed signals and its persistence is unclear. Consumers continue to spend, as confirmed at the end of the month by the Commerce Department’s report that consumption spending rose a healthy 0.4% in May, however, wage and salary income growth and the average hourly wages are not ratcheting up. At the same time, American businesses are sounding a more pessimistic note, as trade was and the fading impact of the 2017 tax cut are holding back business investments. These considerations are worrisome for any forecasts regarding the continued growth for the U.S. economy.
Outside the US, share prices also rose. The MSCI All Country World Index, ex US (NR) gained 6.02% in June and stands 13.60% higher since the start of the year. In Europe, stocks responded to hints of further monetary easing made by Mario Draghi, the European Central Bank President, who also called for a common Eurozone budget as an additional economic shock absorber. In China, notwithstanding trade tensions and signs that China’s economy may be slowing, the MSCI China (NR) Index was up 8.03%.
The Sustainable (SUSTAIN) Large Cap Equity Fund Index posted a strong gain of 6.79% but lagged the S&P 500 by 25 basis points (bps)
Following four months of outperformance, the Sustainable (SUSTAIN) Large Cap Equity Fund Index posted a strong gain of 6.79% but lagged the S&P 500 by 25 basis points (bps). While this was the best increase for the index since adding 7.65% in January, the SUSTAIN Index was hampered by the performance of eight index members that fell behind the conventional large cap benchmark with results ranging from 5.87% to 7.0%. Only two sustainable large cap funds managed to outperform the S&P 500. These included the Pax Large Cap Fund Institutional Shares, up 7.44%, and Domini Impact Equity Investor, up 7.14%. Refer to Table 1.

The $673.9 million Pax Large Cap Fund, with an asset base comprised almost entirely of institutional investors, maintained sector allocations largely in line with the S&P 500 Index, excepting its zero weighting in the Utility sector which recorded a slight but positive result in June with a gain of 0.38%. The fund was buoyed by its small 2.28% cash position but, even more importantly, the fund’s performance was lifted by the large and overweight exposures to firms such as Apple (AAPL) and Microsoft (MSFT) that in June gained 13.05% and 8.31%, respectively.
The second best performing fund, the $760 million Domini Impact Equity Investor Shares, benefited from a fully invested position (0.31% cash as of March 31, 2019) and 10% overweight exposure to technology stocks, 33% versus 23% for the S&P 500. At the same time, the Neuberger Berman Sustainable Equity Institutional Fund, which brought up the rear in 10th position with a still most respectable one-month 5.87% return, was hampered by the fund’s 14.38% investments in non-US stocks and, in particular, European stocks in developed markets, given that MSCI EAFE (NR) lagged the S&P 500 by 1.12%.
Since its inception as of December 31, 2016, or a period of 2.5 years, the SUSTAIN Large Cap Equity Fund Index trails the S&P 500 by 2.74% through the end of June. Refer to Chart 1.

The Sustainable (SUSTAIN) Bond Fund Index also trailed the conventional Bloomberg Barclays US Aggregate Index in June, posting a strong gain of 1.22% versus 1.26%
The Sustainable (SUSTAIN) Bond Fund Index also trailed the conventional Bloomberg Barclays US Aggregate Index in June, posting a strong gain of 1.22% versus 1.26% for the Bloomberg benchmark, for a slight 4 bps differential. Still, this was the fourth month this year during which the SUSTAIN Bond Fund Index recorded gains in excess of 1%. This brings the 3-month total return to 3.14% as compared to 3.08% attributable to the Bloomberg index. Sustainable bond funds also lead on a year-to-date basis as well as trailing twelve months.
This was the second consecutive month of underperformance for the SUSTAIN Bond Fund Index, as eight of the 10 index members recorded gains below 1.26%, with all but one fund, Calvert Bond I, posting a one-month gain excess of 1%. Two funds excelled, including the $464.8 million Morgan Stanley Institutional Core Plus Fixed Income Fund, up 1.68%, and the Parnassus Fixed Income Fund, up 1.45%. The Morgan Stanley fund, which incorporates, as part of the investment process, information about environmental, social and governance issues while the management company may also engage with management of certain issuers regarding corporate governance practices as well as what the fund’s adviser deems to be materially important environmental and/or social issues facing a company, benefited from investments in lower rated bonds, including non-investment-grade and non-rated securities, that outperformed investment-grade instruments in June. The higher “A” average credit quality of the smaller $220.6 million Parnassus Fixed Income Fund that employs a broader sustainable investing strategy that includes ESG integration but also extends to exclusions, impact investing as well as engagement with company managements, was lifted, it seems, by its longer average effective maturity which stood at 8.11 years versus 7.76 years for the Bloomberg benchmark. Refer to Table 2.

Since its inception as of December 31, 2017 through the end of June, or a period of 1.5 years, the SUSTAIN Bond Fund Index continues to outperform the Bloomberg Barclays US Aggregate Index by 25 bps. Refer to Chart 2.

Launch of the Sustainable (SUSTAIN) Foreign Equity Fund Index
The substantial growth over the last year in both the number and assets under management sourced to similarly managed sustainable international mutual funds in general and foreign funds, in particular, has made it possible to create a sustainable mutual fund index that tracks the performance of funds within one or more segments of this market segment. Just in the last 24 months, international funds, including mutual funds and ETFs, expanded from 151 funds/share classes with $15.4 billion in assets under management to 593 funds/share classes and $99.8 billion in assets under management, or almost a seven-fold increase. In large part, this increase is due to the rebranding of existing funds that have adopted sustainable investing strategies, mainly in the form of ESG integration. While this segment is comprised of various investment themes or objectives, ranging from country-specific focused funds, such as Japan oriented stock funds, to emerging market funds, the largest segment, with $44.5 billion in assets of 44.6% of the segment’s total net assets as of June 2019, is sourced to large cap growth, value and hybrid funds that (a) invest in foreign securities, excluding the US, (b) compare themselves to the performance of the MSCI All Country World, ex US Index which represents either the fund’s primary prospectus benchmark or has been determined to track the benchmark based on an analysis of the fund’s style composition (MPT), and (3) are employing a sustainable investing strategy that extends beyond strictly applying exclusionary criteria. The MSCI ACWI ex USA Index captures large and mid-cap companies across 22 of 23 developed markets countries (excluding the US) and 26 emerging markets countries. With 2,206 constituents as of June 2019, the index covers approximately 85% of the global equity opportunity set outside the US. For more details regarding the recent growth in the sustainable foreign mutual funds and ETFs segment, refer to a soon to be published article on this topic.
Launched with an effective date as of June 30, 2019, the Sustainable (SUSTAIN) Foreign Equity Fund Index, like the SUSTAIN Large Cap Equity Fund Index and the SUSTAIN Bond Fund Index, tracks the ten largest funds/share classes that make up the segment while also employing a sustainable investing strategy that extends beyond strictly applying exclusionary criteria. In total, these funds manage $14.6 billion in net assets and represent 32.8% of the segment’s assets under management at the end of June. Refer to the index description appended at the end of the article.
In its inaugural month of June, the index posted a gain of 5.92% versus 6.02% recorded by the MSCI ACWI, ex US, or a differential of 10 basis points. Five of the ten funds that make up the index added to performance with total returns ranging from 6.11% to a high of 6.5% generated by the $247.8 million Boston Common ESG Impact International. At the other end of the range, five funds detracted from June’s performance with results ranging from 4.73% to 5.96%. Refer to Table 3.

The Boston Common ESG Impact International Fund, managed by Boston Common Asset Management, LLC seeks to achieve long-term capital appreciation by investing at least 80% of its net assets in the securities of non U.S. companies, usually companies that have market capitalizations of $2 billion or greater, that meet the Boston Company’s ESG criteria. Up to 10% of the fund’s total assets may be invested in securities of companies located in emerging markets. As of March 31, 2019, the fund’s assets were largely allocated to developed markets with a small 5.86% sleeve allocated to emerging markets. The fund was underweighted in consumer defensive, consumer cyclical and technology stocks and over-weighted in financial services. In June, the fund benefited from its growth orientation.
Boston Common seeks companies with sound governance and histories of responsible financial management that it believes are capable of consistent, visible profitability over a long time horizon. The firm integrates financial and environmental, social, and governance (“ESG”) criteria into its stock selection process, believing that markets typically misvalue the risks and opportunities presented by ESG factors, both in terms of the timing and the magnitude of outcomes. Boston Common also believes that shareowner engagement plays a critically important role in raising the sustainability profile of our portfolios and empowers company management to be long-term in its focus. For further details regarding the fund’s ESG and engagement strategies, click on the Funds Directory tab.
Performance of ESG indices versus non-ESG Indices: Clear wins in June for the S&P 500 conventional index and ESG fixed income
US Equities-The conventional S&P 500 Index led all ESG equity counterparts.

Fixed Income-The MSCI Bloomberg ESG US Aggregate Index led for the month of June by a margin of at least 1 basis point.
Foreign Equities-The conventional MSCI ACWI, ex USA and the MSCI Emerging Markets Index led its non-ESG counterparts while at the same time MSCI EAFE ESG Leaders Index led in its category.
Refer to Chart 3.
Sustainable (SUSTAIN) Foreign Equity Fund Index Explained
The index, which was initiated as of June 30, 2019 with data starting in June 2019, tracks the total return performance of the ten largest actively managed foreign equity mutual funds that employ a sustainable investing strategy beyond absolute reliance on exclusionary practices for religious, ethical or social reasons. While methodologies vary, to qualify for inclusion in the index, funds in excess of $50 million in net assets must actively apply environmental, social and governance (ESG) criteria to their investment processes and decision making. In tandem with their ESG integration strategy, funds may also employ exclusionary strategies along with impact-oriented investment approaches as well as shareholder advocacy.
Eligible foreign mutual funds are selected from the universe of foreign funds that align themselves to the performance of the MSCI All Country World, ex US Index. The index represents either fund’s primary prospectus benchmark or has been determined to track the benchmark based on an analysis of the fund’s style composition (MPT). The MSCI ACWI ex USA Index captures large and mid-cap companies across 22 of 23 developed markets countries (excluding the US) and 26 emerging markets countries. With 2,206 constituents as of June 2019, the index covers approximately 85% of the global equity opportunity set outside the US.
Only the largest single fund or share class managed by an investment management firm is included in the index. Also, a fund with multiple share classes is only included in the index once, based on the largest share class in terms of net assets. The index is equally weighted, it is calculated monthly and rebalanced once a year as of December 31.
The combined assets associated with the ten funds that comprise the index as of June 30, 2019 stood at $14.6 billion and represent about 32.8% of the $44.5 billion in assets sourced to large-cap growth, value and hybrid funds that invest in foreign securities, excluding the US.
Sustainableinvest.com
Benefits
Free access to regularly updated original research and analysis focused exclusively on sustainable finance and investing, providing investors with the guidance needed to make informed investment decisions that align with their personal values and financial goals while also contributing to the advancement of positive long-term environmental and social outcomes.
By offering financial support for our current work, either in the form of a one-time or regular contributions, you help to defray some of the costs associated with conducting our research and analysis as well as to maintain the www.sustainablest.wpengine.com website.
Helping us to expand our research capabilities and offerings over time to cover additional relevant topics geared to sustainable investors.
Sign up to free newsletters.
By submitting this form, you are consenting to receive marketing emails from: . You can revoke your consent to receive emails at any time by using the SafeUnsubscribe® link, found at the bottom of every email. Emails are serviced by Constant Contact