The Bottom Line: Markets rebound in April, as stocks and bonds move sharply higher. Sustainable bond funds outperform but equity funds lag their conventional benchmarks.
Markets rebound in April as stocks and bonds move sharply higher
Optimism fueled by bullish sentiments regarding the COVID-19 medical recovery combined with massive Federal Reserve Bank guarantees of unlimited liquidity and rapid federal government fiscal stimulus measures in the form of grants, loans, loan forgiveness and other programs pushed stocks strongly higher in April to close the month up 12.8% as measured by the S&P 500 and a slightly better 12.85% as measured by the S&P 500 ESG equivalent index. The NASDAQ Composite ended the month even higher, gaining 15.5% while small cap stocks, up 13.7%, and mid-caps, up 14.4%, also eclipsed the broader S&P 500 benchmark. Except for mid-cap stocks, growth outperformed value stocks by a range from 2.6% to 3.7%. Across the board, sustainable mutual funds and ETFs[1] extending from money market funds and up to commodity funds recorded an average gain of 7.79%. These ranged from a low of -4.06% posted by a high yield municipal bond fund to a high of 38.24% registered by a gold and precious metals fund with Master Limited Partnerships and energy infrastructure funds coming in right behind.
Outside the US, stocks staged a more subdued recovery. The MSCI ACWI ex USA gained 7.6% while the MSCI EAFE Index added 6.5%. Emerging markets posted a stronger 9.2% gain while country specific increases across both developed and developing countries as measured by MSCI country indices ranged from a low of 4.4% recorded in France to China’s 6.3% to a high of 14.1% posted by Taiwan which has waged one of the most effective campaigns against the coronavirus pandemic.
Stock market reversed almost 21% of its February to March 23 drop by April month-end
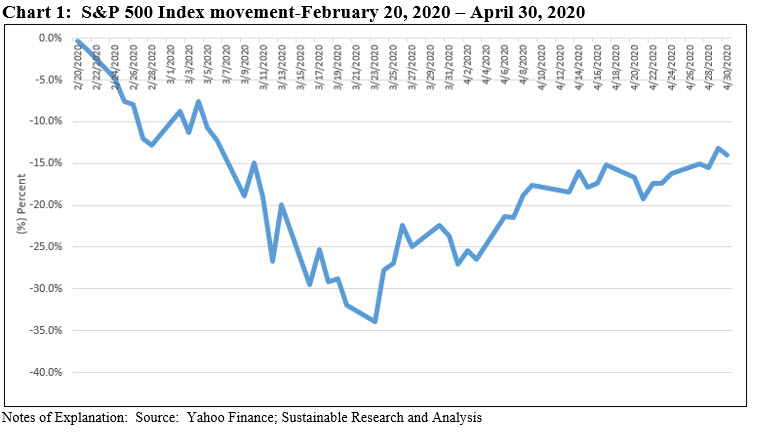
The stock market was down 33.9% at the close of March 23rd from its high on February 19th and by the end of April, it had reversed 20.7%, or 61% of the February to March drop. Refer to Chart 1. Fixed income markets rallied as central banks committed to purchase more government and corporate bonds. The Bloomberg Barclays US Aggregate Bond Index was up 1.2% while the high yield sector gained from 0.5% for Caa rated bonds to 6.5% for Ba rated securities. The Federal Reserve Bank’s commitment to purchase corporate bonds and some high yield bonds, corporate bond exchange-traded funds (ETFs), including some high yield ETFs, contributed to a sharp decline in investment grade and high yield spreads.
Opinions regarding the economic recovery vary considerably and reflect continuing uncertainties over the trajectory of global growth in the next several quarters
Negative economic data was observed at just about every economic front, from GDP which declined at an annual rate of 4.8% in the first quarter to industrial production, new home sales, retail sales, consumer confidence and unemployment claims that increased by 30 million in the last six weeks. Additional negative data still lies ahead. In the end, opinions regarding the economic recovery vary considerably and reflect continuing uncertainties over the trajectory of global growth in the next several quarters. According to one estimate, this one provided by Moody’s Investors, real GDP is expected to contract by 5.7% for the full year. This forecast accounts for the 4.8% contraction in the first quarter and assumes a much sharper contraction in the second quarter, followed by a gradual recovery in the second half of the year. Moody’s expects the unemployment rate to reach a high of between 12% and 17% in the second quarter, driven by the scaling back and closure of businesses in response to a sharp pull back in consumer demand.
The price of oil which had dropped to historic lows due to supply demand imbalances, remained volatile even as an agreement was reached on April 12 by OPEC nations, Russia and other allied producers to slash 9.7 million barrels a day in May and June, or close to 10% of the world’s output. West Texas Intermediate (WTI) oil futures for imminent delivery went negative as weak demand and difficulty in managing US oil storage meant traders were briefly paid to take physical delivery of oil. Still, the energy sector rebounded significantly in April and was the best performing sector in the S&P 500, up 29.8%.
Analysts have lowered their 2020 earnings estimates
On the corporate earnings front, analysts have lowered their 2020 earnings estimates, which are now expected to decline over 15% in the US and Europe. Dividends may also be negatively impacted as companies prioritize balance sheet protection over profit distribution.
Sustainable (SUSTAIN) Large Cap Equity Fund Index lagged S&P 500 by 37 bps
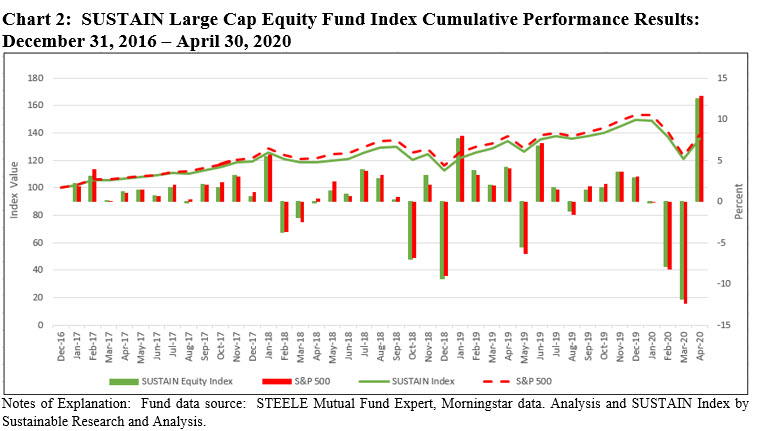
The Sustainable (SUSTAIN) Large Cap Equity Fund Index posted a strong gain of 12.45% in April, recording the best monthly total return since the calculation of the index began as of December 31, 2016 and exceeding by 4.8% the next best monthly performance that occurred in January 2019 when the SUSTAIN Index added 7.65% following the -9.4% decline in December 2018. That said, the April 2020 results lagged 37 bps behind the S&P 500’s 12.82% gain. This follows two consecutive months of outperformance during which time the SUSTAIN Index beat the S&P 500 by 54 bps and 34 bps. Still, the SUSTAIN Index leads the S&P 500 for the past three months, year-to-date and trailing 12-month intervals but continues to lag on a since inception basis by -2.83%. Refer to Table 1 Chart 2.
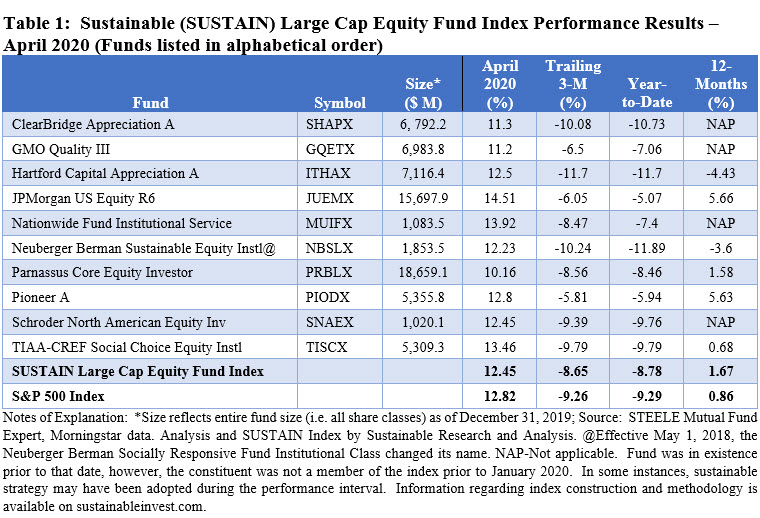
While six of the ten funds that comprise the SUSTAIN index eclipsed the S&P 500 in March, only three funds managed to do so in April. These include JPMorgan US Equity R6, up 14.51%, followed by Nationwide Fund Institutional Service and TIAA-CREF Social Choice Equity Institutional Fund, gaining 13.92% and 13.46% in that order. The JPMorgan US Equity Fund, which integrates ESG into its investment decisions, maintained a high level of exposure to the Technology (24.94%), Healthcare (15.90%) and Communications (13.73%) sectors while also retaining a 1.05% in the Energy sector, the best performing S&P 500 sector in April. The fund benefited in particular from the performance of its top five holdings that made up 25.4% of portfolio assets as of March 31st and included over-weights in Microsoft, Amazon, Alphabet Inc., and Mastercard while slightly underweighting Apple. Returns in April for these five stocks ranged from 22.77% to 30.76%.
Laggards included the Parnassus Core Equity Fund Investor shares, 10.16%, GMO Quality III, 11.2% and ClearBridge Appreciation Fund A, 11.3%.
Sustainable (SUSTAIN) Bond Fund Index beats conventional index by 62 bps
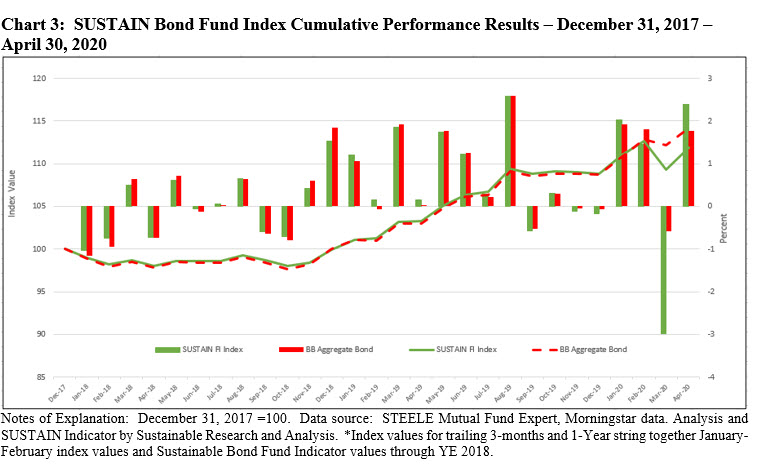
The Sustainable (SUSTAIN) Bond Fund Index recovered 80% of last month’s 2.98% decline with its strong increase of 2.39% in April. This was the second best monthly return posted by the SUSTAIN Bond Fund Index since that start of its calculations as of December 2017 and it also distinguished itself by recording the widest positive spread relative to the conventional Bloomberg Barclays US Aggregate Bond Index at 62 bps. On the other hand, the SUSTAIN Index lags the Bloomberg Barclays US Aggregate Bond Index over the previous three-month, year-to-date, 12-month and since inception time intervals. Refer to Table 2 and Chart 3.
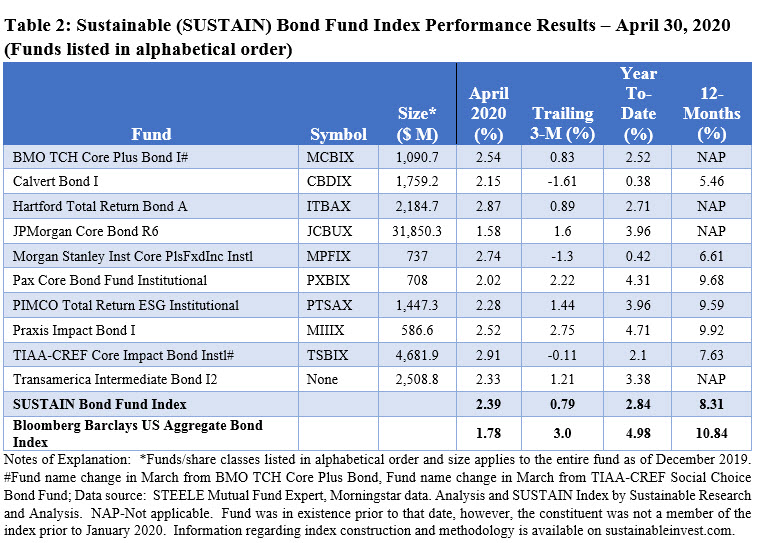
All but one fund beat the Bloomberg Barclays US Aggregate Bond Index in April, with the TIAA-CREF Core Impact Bond Fund Institutional leading in April by posting a 2.91% total return. While its April result didn’t overcome the fund’s -4.39% decline in March in its entirety, the factors that contributed to the drop in March contributed positively in the following month, namely an overweighting in longer-dated securities and allocation to spread products
The JPMorgan Core Bond Fund R6 was the only fund that failed to beat the conventional benchmark in April, posting a 1.58% return.
Sustainable (SUSTAIN) Foreign Equity Fund Index underperformed by 28 bps
After eclipsing the MSCI ACWI ex USA Index for three consecutive months, the Sustainable (SUSTAIN) Foreign Equity Fund Index took a breather. The SUSTAIN Index was up sharply, gaining 7.3% and offsetting about 50% of its March loss, but this wasn’t enough to overcome the increase recorded by the conventional MSCI benchmark that registered a 7.58% gain. This was due to the fact that only four of ten constituent funds beat the MSCI ACWI ex USA Index in April. Still, the SUSTAIN Index remains ahead over the trailing three-months, year-to-date and its short since inception time interval that still doesn’t extend to the full previous twelve months. Refer to Table 3 and Chart 4.
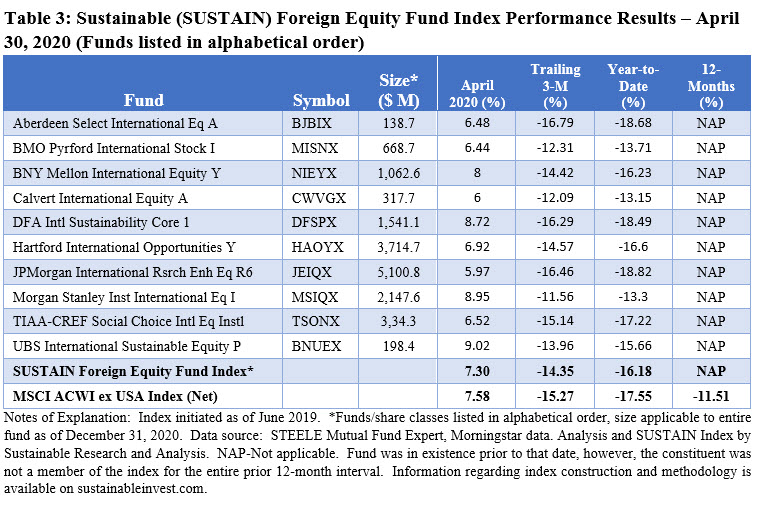
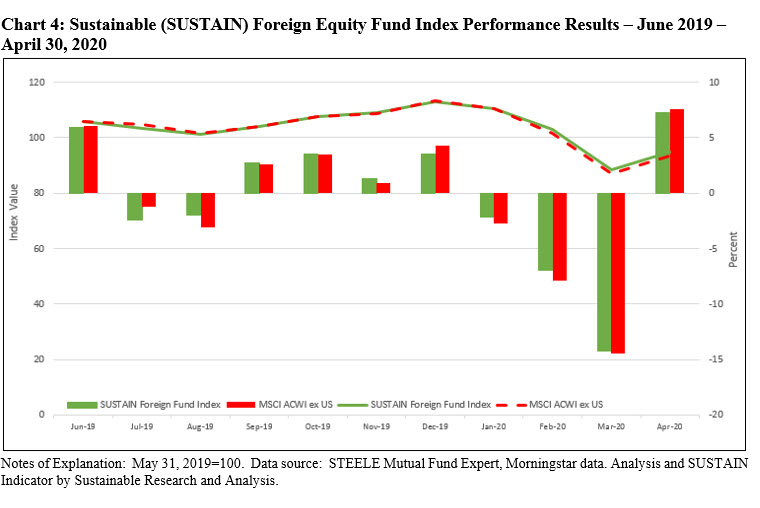
Leading the pack in April is the UBS International Sustainable Equity P that posted a 9.02% return, versus a drop of -15.03% in March. Coming into April, the fund’s top three sector allocations included Financial Services (21.49%), Technology (16.45%) and Healthcare (12.97%), with exposures to the first two sectors exceeding the levels of the other nine funds that make up the SUSTAIN Index. The same can also be said of the fund’s geographic breakdown, as its 45.84% exposure to Greater Asia eclipses the other nine funds. As for security holdings, the fund’s top holdings include Sony Corp., Takeda Pharmaceutical Co., GlaxoSmithKline PLC, Ping An Insurance Group Co. of China Ltd, and PT Bank Central Asia Tbk. None of these top holdings, which account for 12.7% of the fund’s portfolio, correspond to the top holdings in the MSCI ACWI ex USA Index.
At the other end of the range are JPMorgan International Research Enhanced Equity R6 and Calvert International Equity A that posted returns of 5.97% and 6.0%, in that order.
[1] While definitions continue to evolve, sustainable investing refers to a range of five overarching investing approaches or strategies that encompass: values-based investing, negative screening (exclusions), thematic and impact investing, ESG integration and shareholder/bondholder engagement and proxy voting. These are not mutually exclusive.
Sustain Indices in April 2020: Bond Funds Rocked while Equity Funds Lagged
The Bottom Line: Markets rebound in April, as stocks and bonds move sharply higher. Sustainable bond funds outperform but equity funds lag their conventional benchmarks.
Share This Article:
The Bottom Line: Markets rebound in April, as stocks and bonds move sharply higher. Sustainable bond funds outperform but equity funds lag their conventional benchmarks.
Markets rebound in April as stocks and bonds move sharply higher
Optimism fueled by bullish sentiments regarding the COVID-19 medical recovery combined with massive Federal Reserve Bank guarantees of unlimited liquidity and rapid federal government fiscal stimulus measures in the form of grants, loans, loan forgiveness and other programs pushed stocks strongly higher in April to close the month up 12.8% as measured by the S&P 500 and a slightly better 12.85% as measured by the S&P 500 ESG equivalent index. The NASDAQ Composite ended the month even higher, gaining 15.5% while small cap stocks, up 13.7%, and mid-caps, up 14.4%, also eclipsed the broader S&P 500 benchmark. Except for mid-cap stocks, growth outperformed value stocks by a range from 2.6% to 3.7%. Across the board, sustainable mutual funds and ETFs[1] extending from money market funds and up to commodity funds recorded an average gain of 7.79%. These ranged from a low of -4.06% posted by a high yield municipal bond fund to a high of 38.24% registered by a gold and precious metals fund with Master Limited Partnerships and energy infrastructure funds coming in right behind.
Outside the US, stocks staged a more subdued recovery. The MSCI ACWI ex USA gained 7.6% while the MSCI EAFE Index added 6.5%. Emerging markets posted a stronger 9.2% gain while country specific increases across both developed and developing countries as measured by MSCI country indices ranged from a low of 4.4% recorded in France to China’s 6.3% to a high of 14.1% posted by Taiwan which has waged one of the most effective campaigns against the coronavirus pandemic.
Stock market reversed almost 21% of its February to March 23 drop by April month-end
The stock market was down 33.9% at the close of March 23rd from its high on February 19th and by the end of April, it had reversed 20.7%, or 61% of the February to March drop. Refer to Chart 1. Fixed income markets rallied as central banks committed to purchase more government and corporate bonds. The Bloomberg Barclays US Aggregate Bond Index was up 1.2% while the high yield sector gained from 0.5% for Caa rated bonds to 6.5% for Ba rated securities. The Federal Reserve Bank’s commitment to purchase corporate bonds and some high yield bonds, corporate bond exchange-traded funds (ETFs), including some high yield ETFs, contributed to a sharp decline in investment grade and high yield spreads.
Opinions regarding the economic recovery vary considerably and reflect continuing uncertainties over the trajectory of global growth in the next several quarters
Negative economic data was observed at just about every economic front, from GDP which declined at an annual rate of 4.8% in the first quarter to industrial production, new home sales, retail sales, consumer confidence and unemployment claims that increased by 30 million in the last six weeks. Additional negative data still lies ahead. In the end, opinions regarding the economic recovery vary considerably and reflect continuing uncertainties over the trajectory of global growth in the next several quarters. According to one estimate, this one provided by Moody’s Investors, real GDP is expected to contract by 5.7% for the full year. This forecast accounts for the 4.8% contraction in the first quarter and assumes a much sharper contraction in the second quarter, followed by a gradual recovery in the second half of the year. Moody’s expects the unemployment rate to reach a high of between 12% and 17% in the second quarter, driven by the scaling back and closure of businesses in response to a sharp pull back in consumer demand.
The price of oil which had dropped to historic lows due to supply demand imbalances, remained volatile even as an agreement was reached on April 12 by OPEC nations, Russia and other allied producers to slash 9.7 million barrels a day in May and June, or close to 10% of the world’s output. West Texas Intermediate (WTI) oil futures for imminent delivery went negative as weak demand and difficulty in managing US oil storage meant traders were briefly paid to take physical delivery of oil. Still, the energy sector rebounded significantly in April and was the best performing sector in the S&P 500, up 29.8%.
Analysts have lowered their 2020 earnings estimates
On the corporate earnings front, analysts have lowered their 2020 earnings estimates, which are now expected to decline over 15% in the US and Europe. Dividends may also be negatively impacted as companies prioritize balance sheet protection over profit distribution.
Sustainable (SUSTAIN) Large Cap Equity Fund Index lagged S&P 500 by 37 bps


The Sustainable (SUSTAIN) Large Cap Equity Fund Index posted a strong gain of 12.45% in April, recording the best monthly total return since the calculation of the index began as of December 31, 2016 and exceeding by 4.8% the next best monthly performance that occurred in January 2019 when the SUSTAIN Index added 7.65% following the -9.4% decline in December 2018. That said, the April 2020 results lagged 37 bps behind the S&P 500’s 12.82% gain. This follows two consecutive months of outperformance during which time the SUSTAIN Index beat the S&P 500 by 54 bps and 34 bps. Still, the SUSTAIN Index leads the S&P 500 for the past three months, year-to-date and trailing 12-month intervals but continues to lag on a since inception basis by -2.83%. Refer to Table 1 Chart 2.
While six of the ten funds that comprise the SUSTAIN index eclipsed the S&P 500 in March, only three funds managed to do so in April. These include JPMorgan US Equity R6, up 14.51%, followed by Nationwide Fund Institutional Service and TIAA-CREF Social Choice Equity Institutional Fund, gaining 13.92% and 13.46% in that order. The JPMorgan US Equity Fund, which integrates ESG into its investment decisions, maintained a high level of exposure to the Technology (24.94%), Healthcare (15.90%) and Communications (13.73%) sectors while also retaining a 1.05% in the Energy sector, the best performing S&P 500 sector in April. The fund benefited in particular from the performance of its top five holdings that made up 25.4% of portfolio assets as of March 31st and included over-weights in Microsoft, Amazon, Alphabet Inc., and Mastercard while slightly underweighting Apple. Returns in April for these five stocks ranged from 22.77% to 30.76%.
Laggards included the Parnassus Core Equity Fund Investor shares, 10.16%, GMO Quality III, 11.2% and ClearBridge Appreciation Fund A, 11.3%.
Sustainable (SUSTAIN) Bond Fund Index beats conventional index by 62 bps


The Sustainable (SUSTAIN) Bond Fund Index recovered 80% of last month’s 2.98% decline with its strong increase of 2.39% in April. This was the second best monthly return posted by the SUSTAIN Bond Fund Index since that start of its calculations as of December 2017 and it also distinguished itself by recording the widest positive spread relative to the conventional Bloomberg Barclays US Aggregate Bond Index at 62 bps. On the other hand, the SUSTAIN Index lags the Bloomberg Barclays US Aggregate Bond Index over the previous three-month, year-to-date, 12-month and since inception time intervals. Refer to Table 2 and Chart 3.
All but one fund beat the Bloomberg Barclays US Aggregate Bond Index in April, with the TIAA-CREF Core Impact Bond Fund Institutional leading in April by posting a 2.91% total return. While its April result didn’t overcome the fund’s -4.39% decline in March in its entirety, the factors that contributed to the drop in March contributed positively in the following month, namely an overweighting in longer-dated securities and allocation to spread products
The JPMorgan Core Bond Fund R6 was the only fund that failed to beat the conventional benchmark in April, posting a 1.58% return.
Sustainable (SUSTAIN) Foreign Equity Fund Index underperformed by 28 bps


After eclipsing the MSCI ACWI ex USA Index for three consecutive months, the Sustainable (SUSTAIN) Foreign Equity Fund Index took a breather. The SUSTAIN Index was up sharply, gaining 7.3% and offsetting about 50% of its March loss, but this wasn’t enough to overcome the increase recorded by the conventional MSCI benchmark that registered a 7.58% gain. This was due to the fact that only four of ten constituent funds beat the MSCI ACWI ex USA Index in April. Still, the SUSTAIN Index remains ahead over the trailing three-months, year-to-date and its short since inception time interval that still doesn’t extend to the full previous twelve months. Refer to Table 3 and Chart 4.
Leading the pack in April is the UBS International Sustainable Equity P that posted a 9.02% return, versus a drop of -15.03% in March. Coming into April, the fund’s top three sector allocations included Financial Services (21.49%), Technology (16.45%) and Healthcare (12.97%), with exposures to the first two sectors exceeding the levels of the other nine funds that make up the SUSTAIN Index. The same can also be said of the fund’s geographic breakdown, as its 45.84% exposure to Greater Asia eclipses the other nine funds. As for security holdings, the fund’s top holdings include Sony Corp., Takeda Pharmaceutical Co., GlaxoSmithKline PLC, Ping An Insurance Group Co. of China Ltd, and PT Bank Central Asia Tbk. None of these top holdings, which account for 12.7% of the fund’s portfolio, correspond to the top holdings in the MSCI ACWI ex USA Index.
At the other end of the range are JPMorgan International Research Enhanced Equity R6 and Calvert International Equity A that posted returns of 5.97% and 6.0%, in that order.
[1] While definitions continue to evolve, sustainable investing refers to a range of five overarching investing approaches or strategies that encompass: values-based investing, negative screening (exclusions), thematic and impact investing, ESG integration and shareholder/bondholder engagement and proxy voting. These are not mutually exclusive.
Sustainableinvest.com
Benefits
Free access to regularly updated original research and analysis focused exclusively on sustainable finance and investing, providing investors with the guidance needed to make informed investment decisions that align with their personal values and financial goals while also contributing to the advancement of positive long-term environmental and social outcomes.
By offering financial support for our current work, either in the form of a one-time or regular contributions, you help to defray some of the costs associated with conducting our research and analysis as well as to maintain the www.sustainablest.wpengine.com website.
Helping us to expand our research capabilities and offerings over time to cover additional relevant topics geared to sustainable investors.
Sign up to free newsletters.
By submitting this form, you are consenting to receive marketing emails from: . You can revoke your consent to receive emails at any time by using the SafeUnsubscribe® link, found at the bottom of every email. Emails are serviced by Constant Contact