2018: A challenging and turbulent year
In what turned out to be a very challenging and turbulent year, the S&P 500 Index posted its worst performance since 2008. The broad-based index ended 2018 down -4.38% versus -37% in 2008 and compared to a gain of 21.83% in the prior year 2017. In the month of December, the S&P 500 gave up -9.03% and this pushed the fourth quarter results down to -13.52%. European, Asian and China’s markets performed even worse. The MSCI Europe and Asia indexes were down -14.86% and -18.88%, respectively. On the other hand, investment-grade bonds, which were in negative territory all year long, gained 1.84% in December and this lifted the Bloomberg Barclays US Aggregate Index up to 1.64% for the quarter and to an increase of 0.01% for the full year. Benchmarks tracking domestic equity and investment-grade bonds that pursue similar sustainable investing strategies, the SUSTAIN Large Cap Equity Fund Index and the SUSTAIN Bond Fund Indicator, both lagged their corresponding conventional indexes by almost 1% and .06%, respectively.
A positive start to the year turned negative for ESG funds and just missed reaching bear market territory
The year started out on a very positive note. Investors discounted any evidence of economic, geopolitical risk and domestic political tensions and instead emphasized the positives, including the corporate tax cut, low interest rates, low unemployment, a growing economy and rising corporate earnings. The stock market was propelled higher to reach its first 2018 high point at the end of January only to fall back and then regain its footing to reach a high of 9.62% on September 20th. Thereafter, the S&P 500 along with other market indicators suffered a reversal that ended just short of reaching bear market territory on December 24th when the index posted a year-to-date decline of -12.06% and peak to trough drop of -19.78%. It staged a late year-end rally to regain 5.31%. Refer to Chart 1. What changed? Sentiment shifted abruptly at a time when the US economy was widely considered to be in the late innings of the current business cycle and the market seemed like it might be overvalued since stocks were trading at a price/earnings ratio of 22.35 as of September 30, 2018 versus a long-term average of 17.9. Trade tensions between the US and China were escalated, political uncertainty kicked up in the US due to fears of a government shutdown, the pace of economic growth was expected to slow, interest rates were rising and expectations for corporate profits, while still estimated to grow year-over-year by 15% in the fourth quarter, were being scaled back.
Cumulative S&P 500 price performance: 2018
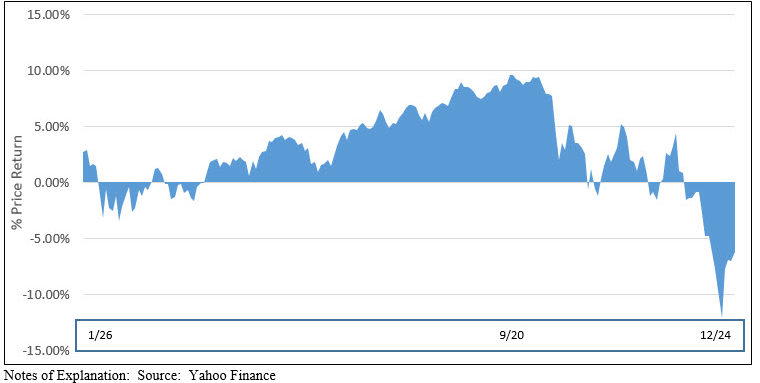
In the month of December, the S&P 500 recorded a sharp decline of -9.03%, but it was by no means the worst performing segment of the market. Small capitalization stocks, as measured by the Russell 2000 Index, which began to lose momentum in the August-September time interval, ended the month down -11.88%. Value stocks also ended the month lower than their growth oriented counterparts, -9.48% versus -8.62%.
Sustainable mutual funds and ETFs posted an average return of -7.80% and -5.69% for the year
Across the range of funds in operation throughout the entire month, a total of 1,271 funds, including mutual funds, exchange traded funds (ETFs) and exchange traded notes (ETNs), extending from money market funds to fixed income funds and to domestic and international funds, designated sustainable funds registered an average return of -5.84% in December. Results ranged from a high of 21.16% generated by the small iPath Carbon ETN to a low of -13.85%, with 187 funds or 15% of funds recording results ≥0.00%. Average total return results for the quarter and 2018 were -10.37% and -7.68%, respectively.
The SUSTAIN Large Cap Equity Fund Index declined -9.38% in December and -5.30% in 2018, lagging the S&P500 during both intervals
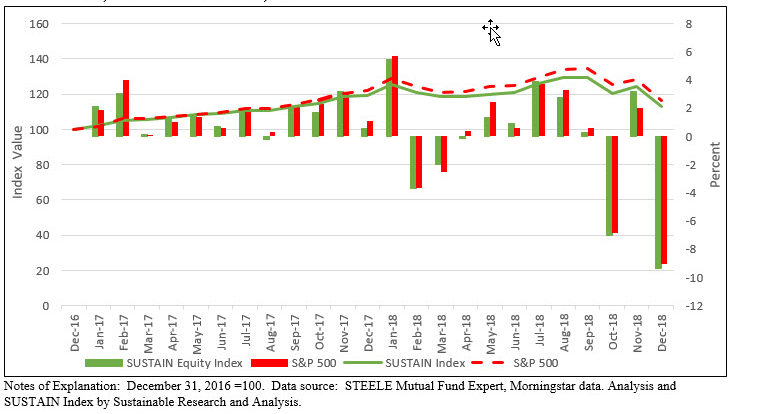
The SUSTAIN Large Cap Equity Fund Index posted a decline of -5.30% during calendar year 2018 as compared to the S&P 500 that was down -4.38%, for a differential of 92 basis points. Seven of the ten funds that comprise the index outperformed the S&P 500, with only one fund, the Calvert Equity Fund Class A actually posting a gain of 5.04%. Calculations of the SUSTAIN Index commenced as of December 31, 2016 and during its first year, the index also lagged the S&P 500. It registered a gain of 19.18% in 2017 versus 21.83% for the S&P 500 Index. The cumulative 2-year lag is now 3.69%. Calvert Equity A is the only fund of ten to exceed the performance of the S&P 500 Index over the 2-year period with a total return of 25.79%, a full 3.96% in excess of the 21.83% posted by the S&P 500. Refer to Table 1 and Chart 2.
SUSTAIN Large Cap Equity Fund Index Performance Results-December 2018
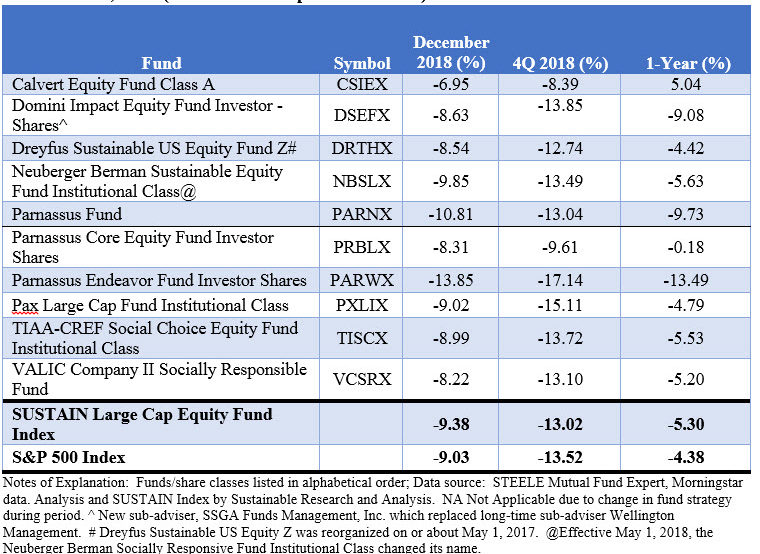
Although still posting a negative total return in December, Calvert Equity Fund Class A was the best performing of the ten funds that comprise the SUSTAIN Large Cap Equity Fund Index. The fund gave up a more limited -6.95% and beat out the next best performer, Parnassus Core Equity Fund Investor Shares, by 136 basis points. Calvert Equity was also the best performing fund in the fourth quarter as well as the entire calendar year 2018, leading in performance at various times for five of the 12 months of the year. The $2.2 billion growth oriented fund that invests in a more limited number of stocks with an emphasis on large market capitalizations and is sub-advised by an affiliated company, Atlanta Capital Management Company, LLC, is also the only fund among the SUSTAIN index components to record a positive 5.04% total return result for the entire 12-month period ending in December.
Contributing to and detracting from the Calvert Equity Fund’s performance were sectors and stocks owned as well as sectors and stocks that the fund did not hold. The fund’s overweighting in the basic materials sector at 8.48% relative to the 2.56% allocation within the broader S&P 500 Index cushioned the decline as the sector was the third best performer in December. Basic materials gave up -5.64%, third only to utilities (-3.29%) and communications services (-4.95%). Also, the fund’s 0.0% exposure to the energy sector due to the avoidance of fossil fuels investments based on the Calvert Principles for Responsible Investment allowed the fund to side step the worst performing energy sector in December, down -11.39%, and for the entire year 2018, down -15.74%. While not owing Facebook, Inc. (FB) due to inadequate controls protecting user privacy aided the fund’s performance particularly following Facebook’s late July swoon, avoiding Amazon.com, Inc. (AMZN) and Apple Inc. (AAPL) due to fundamental considerations also slightly contributed to the fund’s performance in December as these two stocks registered declines that exceeded the S&P 500.
The next two funds in rank order were Parnassus Core Equity Fund Investor Shares and Dreyfus Sustainable US Equity Fund Z Shares, down -8.31% and -8.54%, respectively. Both funds also managed to eclipse the fourth quarter results recorded by the S&P 500 while Parnassus Core Equity also did so for the entire calendar year 2018.
As noted earlier, the SUSTAIN Large Cap Equity Index Fund results for December ranged from a high of -6.95% to a low of -13.85%, or a range of 6.90%. The lowest return was posted by Parnassus Endeavor Fund Investor Shares, a $3.7 billion fund that invests in large capitalization stocks “with low turnover and high conviction in approximately 30 holdings.” The fund “invests in companies that represent Parnassus’ clearest expression of ESG investing: portfolio companies must offer outstanding workplaces, and must not be engaged in the extraction, exploration, production, manufacturing, or refining of fossil fuels. This workplace focus can result in significant exposure to technology companies, many of which are leaders in offering positive and innovative workplaces.” Parnassus recognized that the market was overvalued and its strategy had been to avoid highflyers. Even as this was intended to manage downside risks, the fund was hit hard due to its heavy weighting in technology that was partially offset by avoiding the poorest performing energy sector. Beyond that, some of the fund’s positions, such as its 5.95% holding in Mattel, Inc. (MAT) or 5.28% position in CVS Health Corp. (CVS) and 5.2% holding in Micron Technology, Inc. (MU) suffered declines ranging from 29% to 18% during the month of December. The same fund ranked 10th in terms of results for the quarter as well as the entire 2018 calendar year. At the same time, a sister fund, the Parnassus Core Equity Investor Shares turned in the second best performance across the ten index constituents in 2018 with a total return of -0.18% versus the S&P 500.
SUSTAIN Bond Fund Indicator recorded a December gain of 1.52% versus the Bloomberg Barclays US Aggregate Index gain of 1.84%; full year results lagged by 0.06%
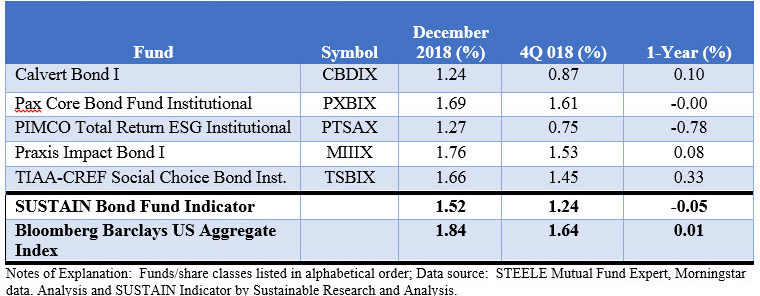
In an uncertain and volatile month when investors sought safer ground, 10-year treasury yields dropped by 32 basis points from 3.01% to 2.69% after reaching an October high of 3.24%, long-term high quality bonds posted the best returns. Excluding gold and precious metals, longer dated high quality bonds posted some of the best results in December. For example, the Bloomberg Barclays US Treasury 20+ Year Total Return Index recorded an increase of 5.59%. Against this back drop, the SUSTAIN Bond Fund Indicator achieved a gain of 1.52% versus 1.84% posted by the Bloomberg Barclays US Aggregate Index. These were the best monthly gains for both indexes during 2018 and one of the bright spots in an otherwise negative month for most market segments. That said, the SUSTAIN indicator lagged the conventional index for the second month in a row and only the fourth time in 2018 to do so. It also fell behind for the full year, closing out with a slight decline of -0.05% versus a gain of 0.01% for the Bloomberg Barclays US Aggregate Index for a fractional 0.06% difference. Refer to Table 2 and Chart 3.
SUSTAIN Bond Fund Indicator Performance Results-December 31,2018
SUSTAIN Bond Fund Indicator Performance Results-December 31,2017-December 31,2018
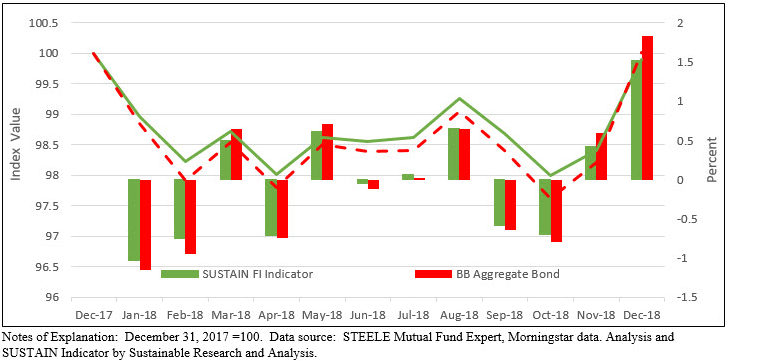
None of the five funds that make up the fixed income indicator beat the conventional index, but the best performing funds in December, Praxis Impact Bond I and Pax Core Bond Fund Institutional Shares maintained longer effective durations and a higher average credit quality relative to the other three funds.
Sustainable (SUSTAIN) Large Cap Equity Fund Index Explained
The index, which was initiated as of June 30, 2017 with data back to December 31, 2016, tracks the total return performance of the ten largest actively managed large cap domestic equity mutual funds that employ a sustainable investing strategy beyond absolute reliance on exclusionary practices for religious, ethical or social reasons. While methodologies vary, to qualify for inclusion in the index, funds in excess of $50 million in net assets must actively apply environmental, social and governance (ESG) criteria to their investment processes and decision making. In tandem with their ESG integration strategy, funds may also employ exclusionary strategies along with impact oriented investment approaches as well as shareholder advocacy.
Multiple funds managed by the same management firm may be included in the index, however, a fund with multiple share classes is only included in the index once, based on the largest share class in terms of assets. The index is equally weighted, it is calculated monthly and rebalanced once a year as of December 31.
The combined assets associated with the ten funds stood at $21.2 billion and represent about 13.7% of the entire sustainable US equity sector that is comprised of 220 funds/share classes, including actively managed funds and index funds, with $154.4 billion in assets under management.
Sustainable (SUSTAIN) Bond Fund Indicator Explained
This benchmark, which was initiated as of December 31, 2017, tracks the total return performance of the five largest actively managed investment-grade intermediate term bond mutual funds that employ a sustainable investing strategy beyond absolute reliance on exclusionary practices for religious, ethical or social reasons. While methodologies vary, to qualify for inclusion in the benchmark, funds in excess of $50 million in net assets must actively apply environmental, social and governance (ESG) criteria to their investment processes and decision making. In tandem with their ESG integration strategy, funds may also employ exclusionary strategies, impact oriented investment approaches as well as issuer-oriented advocacy.
Multiple funds managed by the same management firm may be included in the benchmark, however, a fund with multiple share classes is only included once, based on the largest share class in terms of assets. The indicator is equally weighted, it is calculated monthly and rebalanced once a year as of December 31.
At the time it was constructed as of December 31, 2017 less than 10 funds qualified under the criteria set forth above and for this reason to distinguish this measure from a more robust one in terms of number of constituent funds, the benchmark is referred to as an indicator rather than an index. The combined assets associated with the five funds stood at $2.7 billion and these funds account for 15.3% of the entire sustainable US taxable fixed income sector that is comprised of 109 funds/share classes, including actively managed funds and index funds for a total of $17.8 billion in assets under management.
SUSTAIN Large Cap Equity Index Declined -9.38% in December and -5.30% in 2018
2018: A challenging and turbulent year
Share This Article:
2018: A challenging and turbulent year
In what turned out to be a very challenging and turbulent year, the S&P 500 Index posted its worst performance since 2008. The broad-based index ended 2018 down -4.38% versus -37% in 2008 and compared to a gain of 21.83% in the prior year 2017. In the month of December, the S&P 500 gave up -9.03% and this pushed the fourth quarter results down to -13.52%. European, Asian and China’s markets performed even worse. The MSCI Europe and Asia indexes were down -14.86% and -18.88%, respectively. On the other hand, investment-grade bonds, which were in negative territory all year long, gained 1.84% in December and this lifted the Bloomberg Barclays US Aggregate Index up to 1.64% for the quarter and to an increase of 0.01% for the full year. Benchmarks tracking domestic equity and investment-grade bonds that pursue similar sustainable investing strategies, the SUSTAIN Large Cap Equity Fund Index and the SUSTAIN Bond Fund Indicator, both lagged their corresponding conventional indexes by almost 1% and .06%, respectively.
A positive start to the year turned negative for ESG funds and just missed reaching bear market territory
The year started out on a very positive note. Investors discounted any evidence of economic, geopolitical risk and domestic political tensions and instead emphasized the positives, including the corporate tax cut, low interest rates, low unemployment, a growing economy and rising corporate earnings. The stock market was propelled higher to reach its first 2018 high point at the end of January only to fall back and then regain its footing to reach a high of 9.62% on September 20th. Thereafter, the S&P 500 along with other market indicators suffered a reversal that ended just short of reaching bear market territory on December 24th when the index posted a year-to-date decline of -12.06% and peak to trough drop of -19.78%. It staged a late year-end rally to regain 5.31%. Refer to Chart 1. What changed? Sentiment shifted abruptly at a time when the US economy was widely considered to be in the late innings of the current business cycle and the market seemed like it might be overvalued since stocks were trading at a price/earnings ratio of 22.35 as of September 30, 2018 versus a long-term average of 17.9. Trade tensions between the US and China were escalated, political uncertainty kicked up in the US due to fears of a government shutdown, the pace of economic growth was expected to slow, interest rates were rising and expectations for corporate profits, while still estimated to grow year-over-year by 15% in the fourth quarter, were being scaled back.
Cumulative S&P 500 price performance: 2018
In the month of December, the S&P 500 recorded a sharp decline of -9.03%, but it was by no means the worst performing segment of the market. Small capitalization stocks, as measured by the Russell 2000 Index, which began to lose momentum in the August-September time interval, ended the month down -11.88%. Value stocks also ended the month lower than their growth oriented counterparts, -9.48% versus -8.62%.
Sustainable mutual funds and ETFs posted an average return of -7.80% and -5.69% for the year
Across the range of funds in operation throughout the entire month, a total of 1,271 funds, including mutual funds, exchange traded funds (ETFs) and exchange traded notes (ETNs), extending from money market funds to fixed income funds and to domestic and international funds, designated sustainable funds registered an average return of -5.84% in December. Results ranged from a high of 21.16% generated by the small iPath Carbon ETN to a low of -13.85%, with 187 funds or 15% of funds recording results ≥0.00%. Average total return results for the quarter and 2018 were -10.37% and -7.68%, respectively.
The SUSTAIN Large Cap Equity Fund Index declined -9.38% in December and -5.30% in 2018, lagging the S&P500 during both intervals
The SUSTAIN Large Cap Equity Fund Index posted a decline of -5.30% during calendar year 2018 as compared to the S&P 500 that was down -4.38%, for a differential of 92 basis points. Seven of the ten funds that comprise the index outperformed the S&P 500, with only one fund, the Calvert Equity Fund Class A actually posting a gain of 5.04%. Calculations of the SUSTAIN Index commenced as of December 31, 2016 and during its first year, the index also lagged the S&P 500. It registered a gain of 19.18% in 2017 versus 21.83% for the S&P 500 Index. The cumulative 2-year lag is now 3.69%. Calvert Equity A is the only fund of ten to exceed the performance of the S&P 500 Index over the 2-year period with a total return of 25.79%, a full 3.96% in excess of the 21.83% posted by the S&P 500. Refer to Table 1 and Chart 2.
SUSTAIN Large Cap Equity Fund Index Performance Results-December 2018
Although still posting a negative total return in December, Calvert Equity Fund Class A was the best performing of the ten funds that comprise the SUSTAIN Large Cap Equity Fund Index. The fund gave up a more limited -6.95% and beat out the next best performer, Parnassus Core Equity Fund Investor Shares, by 136 basis points. Calvert Equity was also the best performing fund in the fourth quarter as well as the entire calendar year 2018, leading in performance at various times for five of the 12 months of the year. The $2.2 billion growth oriented fund that invests in a more limited number of stocks with an emphasis on large market capitalizations and is sub-advised by an affiliated company, Atlanta Capital Management Company, LLC, is also the only fund among the SUSTAIN index components to record a positive 5.04% total return result for the entire 12-month period ending in December.
Contributing to and detracting from the Calvert Equity Fund’s performance were sectors and stocks owned as well as sectors and stocks that the fund did not hold. The fund’s overweighting in the basic materials sector at 8.48% relative to the 2.56% allocation within the broader S&P 500 Index cushioned the decline as the sector was the third best performer in December. Basic materials gave up -5.64%, third only to utilities (-3.29%) and communications services (-4.95%). Also, the fund’s 0.0% exposure to the energy sector due to the avoidance of fossil fuels investments based on the Calvert Principles for Responsible Investment allowed the fund to side step the worst performing energy sector in December, down -11.39%, and for the entire year 2018, down -15.74%. While not owing Facebook, Inc. (FB) due to inadequate controls protecting user privacy aided the fund’s performance particularly following Facebook’s late July swoon, avoiding Amazon.com, Inc. (AMZN) and Apple Inc. (AAPL) due to fundamental considerations also slightly contributed to the fund’s performance in December as these two stocks registered declines that exceeded the S&P 500.
The next two funds in rank order were Parnassus Core Equity Fund Investor Shares and Dreyfus Sustainable US Equity Fund Z Shares, down -8.31% and -8.54%, respectively. Both funds also managed to eclipse the fourth quarter results recorded by the S&P 500 while Parnassus Core Equity also did so for the entire calendar year 2018.
As noted earlier, the SUSTAIN Large Cap Equity Index Fund results for December ranged from a high of -6.95% to a low of -13.85%, or a range of 6.90%. The lowest return was posted by Parnassus Endeavor Fund Investor Shares, a $3.7 billion fund that invests in large capitalization stocks “with low turnover and high conviction in approximately 30 holdings.” The fund “invests in companies that represent Parnassus’ clearest expression of ESG investing: portfolio companies must offer outstanding workplaces, and must not be engaged in the extraction, exploration, production, manufacturing, or refining of fossil fuels. This workplace focus can result in significant exposure to technology companies, many of which are leaders in offering positive and innovative workplaces.” Parnassus recognized that the market was overvalued and its strategy had been to avoid highflyers. Even as this was intended to manage downside risks, the fund was hit hard due to its heavy weighting in technology that was partially offset by avoiding the poorest performing energy sector. Beyond that, some of the fund’s positions, such as its 5.95% holding in Mattel, Inc. (MAT) or 5.28% position in CVS Health Corp. (CVS) and 5.2% holding in Micron Technology, Inc. (MU) suffered declines ranging from 29% to 18% during the month of December. The same fund ranked 10th in terms of results for the quarter as well as the entire 2018 calendar year. At the same time, a sister fund, the Parnassus Core Equity Investor Shares turned in the second best performance across the ten index constituents in 2018 with a total return of -0.18% versus the S&P 500.
SUSTAIN Bond Fund Indicator recorded a December gain of 1.52% versus the Bloomberg Barclays US Aggregate Index gain of 1.84%; full year results lagged by 0.06%
In an uncertain and volatile month when investors sought safer ground, 10-year treasury yields dropped by 32 basis points from 3.01% to 2.69% after reaching an October high of 3.24%, long-term high quality bonds posted the best returns. Excluding gold and precious metals, longer dated high quality bonds posted some of the best results in December. For example, the Bloomberg Barclays US Treasury 20+ Year Total Return Index recorded an increase of 5.59%. Against this back drop, the SUSTAIN Bond Fund Indicator achieved a gain of 1.52% versus 1.84% posted by the Bloomberg Barclays US Aggregate Index. These were the best monthly gains for both indexes during 2018 and one of the bright spots in an otherwise negative month for most market segments. That said, the SUSTAIN indicator lagged the conventional index for the second month in a row and only the fourth time in 2018 to do so. It also fell behind for the full year, closing out with a slight decline of -0.05% versus a gain of 0.01% for the Bloomberg Barclays US Aggregate Index for a fractional 0.06% difference. Refer to Table 2 and Chart 3.
SUSTAIN Bond Fund Indicator Performance Results-December 31,2018

SUSTAIN Bond Fund Indicator Performance Results-December 31,2017-December 31,2018
None of the five funds that make up the fixed income indicator beat the conventional index, but the best performing funds in December, Praxis Impact Bond I and Pax Core Bond Fund Institutional Shares maintained longer effective durations and a higher average credit quality relative to the other three funds.
Sustainable (SUSTAIN) Large Cap Equity Fund Index Explained
The index, which was initiated as of June 30, 2017 with data back to December 31, 2016, tracks the total return performance of the ten largest actively managed large cap domestic equity mutual funds that employ a sustainable investing strategy beyond absolute reliance on exclusionary practices for religious, ethical or social reasons. While methodologies vary, to qualify for inclusion in the index, funds in excess of $50 million in net assets must actively apply environmental, social and governance (ESG) criteria to their investment processes and decision making. In tandem with their ESG integration strategy, funds may also employ exclusionary strategies along with impact oriented investment approaches as well as shareholder advocacy.
Multiple funds managed by the same management firm may be included in the index, however, a fund with multiple share classes is only included in the index once, based on the largest share class in terms of assets. The index is equally weighted, it is calculated monthly and rebalanced once a year as of December 31.
The combined assets associated with the ten funds stood at $21.2 billion and represent about 13.7% of the entire sustainable US equity sector that is comprised of 220 funds/share classes, including actively managed funds and index funds, with $154.4 billion in assets under management.
Sustainable (SUSTAIN) Bond Fund Indicator Explained
This benchmark, which was initiated as of December 31, 2017, tracks the total return performance of the five largest actively managed investment-grade intermediate term bond mutual funds that employ a sustainable investing strategy beyond absolute reliance on exclusionary practices for religious, ethical or social reasons. While methodologies vary, to qualify for inclusion in the benchmark, funds in excess of $50 million in net assets must actively apply environmental, social and governance (ESG) criteria to their investment processes and decision making. In tandem with their ESG integration strategy, funds may also employ exclusionary strategies, impact oriented investment approaches as well as issuer-oriented advocacy.
Multiple funds managed by the same management firm may be included in the benchmark, however, a fund with multiple share classes is only included once, based on the largest share class in terms of assets. The indicator is equally weighted, it is calculated monthly and rebalanced once a year as of December 31.
At the time it was constructed as of December 31, 2017 less than 10 funds qualified under the criteria set forth above and for this reason to distinguish this measure from a more robust one in terms of number of constituent funds, the benchmark is referred to as an indicator rather than an index. The combined assets associated with the five funds stood at $2.7 billion and these funds account for 15.3% of the entire sustainable US taxable fixed income sector that is comprised of 109 funds/share classes, including actively managed funds and index funds for a total of $17.8 billion in assets under management.
Sustainableinvest.com
Benefits
Free access to regularly updated original research and analysis focused exclusively on sustainable finance and investing, providing investors with the guidance needed to make informed investment decisions that align with their personal values and financial goals while also contributing to the advancement of positive long-term environmental and social outcomes.
By offering financial support for our current work, either in the form of a one-time or regular contributions, you help to defray some of the costs associated with conducting our research and analysis as well as to maintain the www.sustainablest.wpengine.com website.
Helping us to expand our research capabilities and offerings over time to cover additional relevant topics geared to sustainable investors.
Sign up to free newsletters.
By submitting this form, you are consenting to receive marketing emails from: . You can revoke your consent to receive emails at any time by using the SafeUnsubscribe® link, found at the bottom of every email. Emails are serviced by Constant Contact