The Bottom Line: Stocks and many bonds retreat in one of the most volatile months in stock market history. SUSTAIN equity indices beat their conventional benchmarks.
Stocks and many bond segments retreat in one of the most volatile months in stock market history
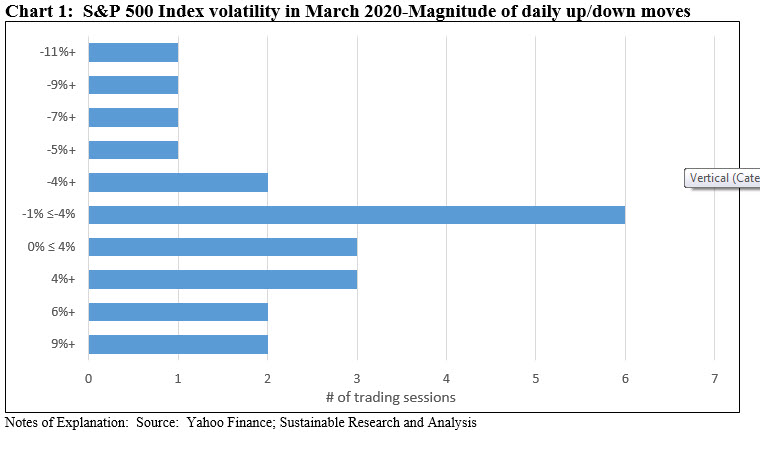
The month of March has been one of the most volatile in stock market history, as the world-wide corona virus pandemic produced a simultaneous health crisis, financial crisis and potentially widespread business failures. Of 22 trading days during the month of March, all but nine trading sessions, or 59%, recorded daily gains or declines greater than 4%. Refer to Chart 1. Four sessions experienced price gains or drops equal to or greater than 9%, a reflection of the uncertainty in estimating the economic toll of the crisis given the significant unknowns, such as how long the virus will take to be fully contained, the duration and severity of the economic disruption, the consequence on corporate earnings as well as the combined impact of government and Federal Reserve actions, to mention just a few of the uncertainties. The uncertainty induced volatilities could also be observed in the March returns across a variety of asset classes and security types that settled within a range that extended from a positive 21.77% recorded by 20+ US treasury bonds to a low of -66.46% registered by Nymex crude. The S&P 500 ended the month -12.4% lower as all sectors posted negative results ranging from -5.4% for Consumer Staples to -34.8% for the Energy sector. At the same time, the Dow Jones Industrial Average and the Nasdaq Composite gave up -13.6% and -10.0%, in that order. Small company stocks, as measured by the Russell 2000, recorded a decline of -21.7% while small cap value stocks performed even worse, giving up -24.7% versus -19.1% for growth stocks. In fact, value stocks across the market cap continuum trailed growth stocks by a range from 5.6% to 7.8% for midcap stocks.
Outside the US, equities in many markets performed even worse, with the MSCI ACWI ex USA giving up -14.5% whereas emerging markets dropped -15.4%. Europe retreated by -14.4% while Latin America was the worst performing region, posting a decline of -34.5%. China, which was reported to have arrested any new cases of Covid-19 and was trying to restore normal life, declined -6.6% and was best national performer in March.
As for bonds, while long-dated US Treasuries ended in strong positive territory, the Bloomberg Barclays US Aggregate Bond Index registered a slight -0.6% decline. Investment-grade corporate bonds and even municipal bonds registered declines of -6.6% and -3.6%, respectively, but at the same time high yield bonds dropped -11.5% and Caa rated bonds ended even lower at -18.4%.
From a debate that in February still focused on the likelihood of an extension to the current extended economic cycle, the conversation has now shifted to how steep the recession will be in the second quarter and whether it will extend into the third quarter. More remote and less frequently discussed, but not out of the question entirely, is the possibility of a depression. According to Moody’s Investors, the firm expects “G-20 real GDP to contract by 0.5% in 2020, followed by a pickup to 3.2% growth in 2021.” In November last year, before the emergence of the coronavirus, Moody’s was expecting G-20 economies to grow by 2.6% in 2020. At the same time, the impact of the coronavirus on emerging markets could be even more severe and the recovery might be slower. But the depth and duration of the recession will in large part depend on the extent to which governments step in to support to their economies to avert permanent damage to households and businesses. In the US, a $2 trillion federal stimulus package was approved by Congress on March 27 and signed into law. This combined with the unprecedented action taken by the Federal Reserve should help soften the blow. Outside the US, fiscal and monetary authorities have also adopted important policy measures to support their economies with a view toward sustaining households and businesses. That said, some economies that were struck by the pandemic before Europe and the US have begun the slow albeit uncertain recovery process. This is the case in China, for example, that is expected to experience growth of 3.3% in 2020 versus an estimated 6.1% in 2019.
Sustainable mutual funds and ETFs[1]: Average decline of -11.94% across all fund types
The expanding universe of sustainable mutual funds/share classes and ETFs, 4,223 in total, ranging from money market funds to bond funds to US equity and international funds, posted an average decline of -11.94% in March. Returns spanned a range of 42.74% that extended from a high of 2.42% to a low of -40.32%. Only 199 funds/share classes or 4.7% of all funds/share classes, mostly money market funds, posted positive returns. The three Sustainable (SUSTAIN) Indices, tracking large cap equity funds, bond funds and foreign funds, posted declines of -11.81%, -2.98% and -14.20%, in that order. The two equity fund indices outperformed their corresponding conventional securities market benchmarks.
Sustainable (SUSTAIN) Large Cap Equity Fund Index beats S&P 500 by 59 bps
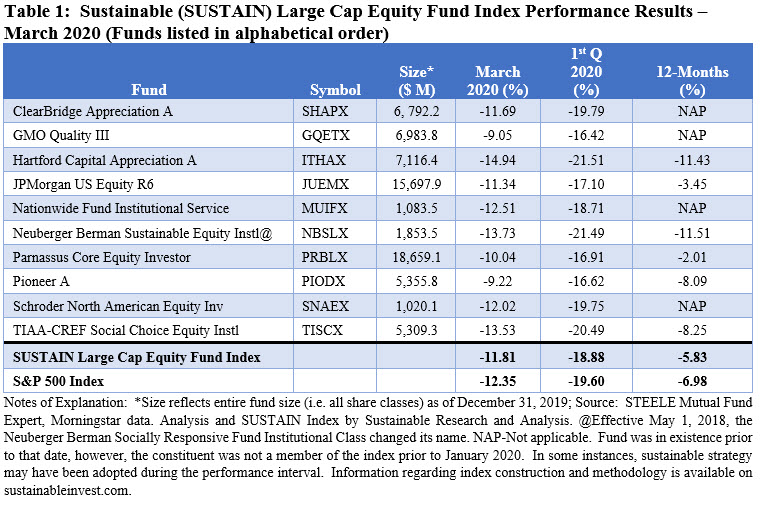
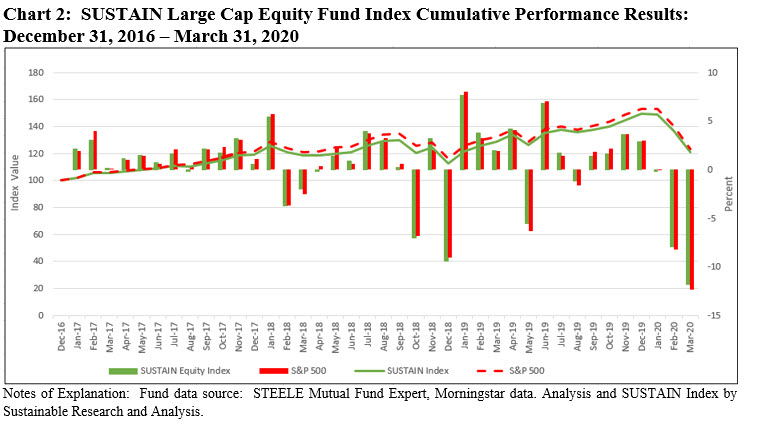
For the second month in succession during the February-March downturn, the Sustainable (SUSTAIN) Large Cap Equity Fund Index beat the S&P 500 by 59 basis points (bps) in March as six funds outperformed the conventional benchmark. The SUSTAIN Large Cap Equity Fund Index also leads the S&P 500 for the first quarter and trailing 12-months but lags since the inception of the index as of December 31, 2016. Since that date, there have been eight months during which the stock market turned in negative results and the SUSTAIN Index has outperformed in five of the eight months. Refer to Table 1 and Chart 2.
Excepting for exposure to the Industrial sector that varied by slightly over 2%, sector allocations in the aggregate for the SUSTAIN Large Cap index members were largely aligned with the S&P 500. That said, variations across individual funds were, in some cases, extensive. For example, GMO Quality III maintained a 40% exposure to the technology sector which was perceived to be in a better position to whether the financial crisis with their higher cash hoards while also entirely avoiding the hard hit energy sector. Parnassus Core Equity was the only other fund to entirely avoid the energy sector while the other eight funds maintained exposures ranging from 1.37% to a high of 5.16% reported by ClearBridge Appreciation Fund A.
GMO Quality III and Pioneer A were the best performers, posting -9.05% and -9.22%, respectively. At the other end of the range, Neuberger Berman Sustainable Equity Fund Institutional brought up the rear. The fund’s 17.7% exposure to European stocks, which didn’t perform as well, may have been a contributing factor.
Sustainable (SUSTAIN) Bond Fund Index trails by a wide 2.39%
The Sustainable (SUSTAIN) Bond Fund Index recorded a -2.98% total return in March, lagging by 2.39% the -0.59% return recorded by the Bloomberg Barclays US Aggregate Bond Index. This was the widest gap between the two indices observed since launch of the SUSTAIN Bond Fund Index as of December 2017 and it came after the index posted 2 consecutive months of strong total returns, 2.04% in January and 1.5% in February. This was also an unusual outcome in March in that none of the 10 funds that make up the SUSTAIN Index managed to beat the conventional benchmark. Refer to Table 2 and Chart 3.
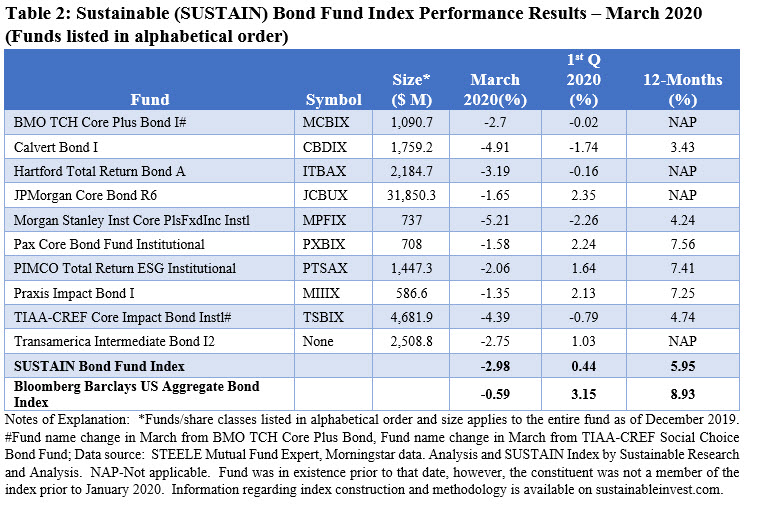
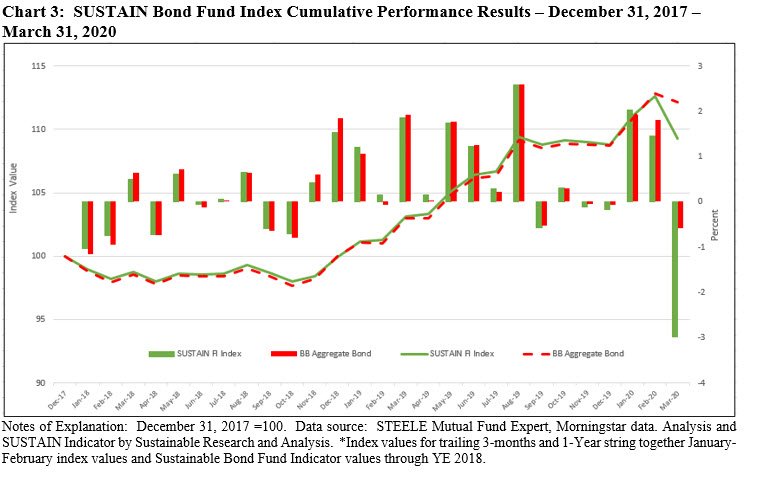
Fund returns ranged from -5.21% recorded by the Morgan Stanley Institutional Core Plus Fixed Income Fund Institutional to -1.5% delivered by Pax Core Bond Fund Institutional. While the effective durations of the two portfolios were not dissimilar, the higher credit quality of the Pax Core Bond Fund, with 95.1% of portfolio assets in BBB or better quality assets, likely served to bolster the fund’s performance in March.
Unrelated to performance, there were two name changes in March. TIAA-CREF Social Choice Bond Fund is now the TIAA-CREF Core Impact Bond and the BMO TCH Core Plus Bond Fund is now the BMO Core Plus Bond Fund. The funds’ investment objectives and sustainable investing approaches remain unchanged.
Sustainable (SUSTAIN) Foreign Equity Fund Index outperforms by 28 bps
Posting a -14.2% decline in March, the Sustainable (SUSTAIN) Foreign Equity Fund Index recorded its worst monthly total return since the start of its short period of calculation as of June 2019 and the third consecutive monthly negative return. On a positive note, the SUSTAIN Index outperformed its conventional counterpart, the MSCI ACWI ex USA (net), by 28 bps and also in each of the last individual three months. The SUSTAIN Foreign Equity Index now leads by 1.47% and 1.38% for the quarter as well as the eight months since inception. Refer to Table 3 and Chart 4.
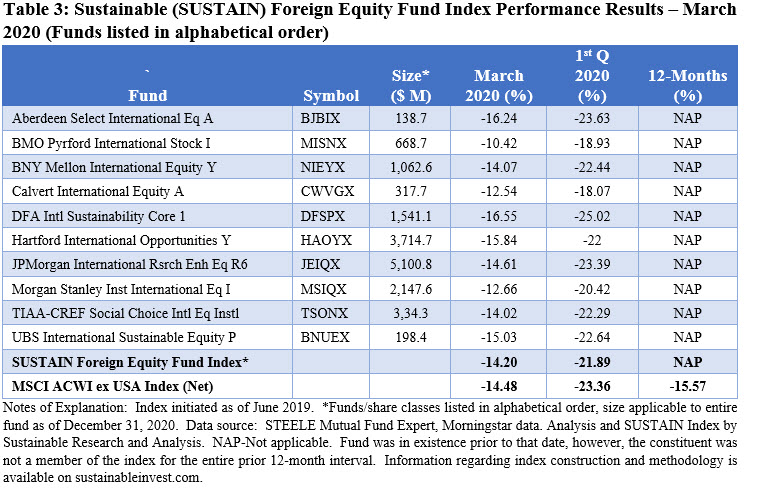
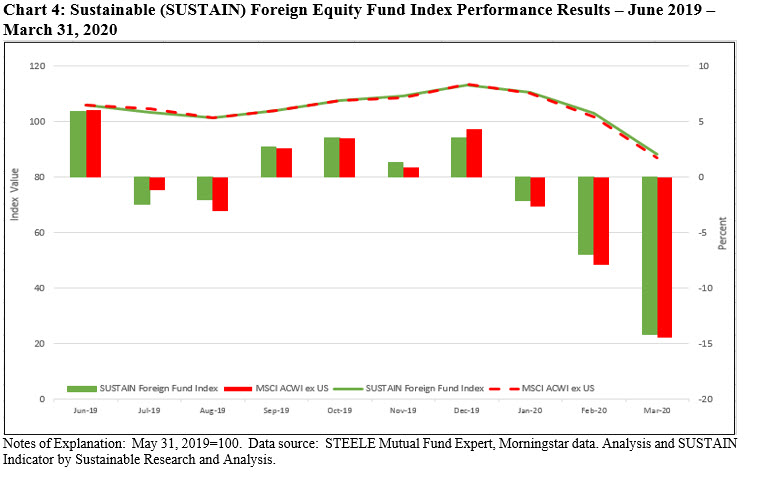
Returns in March produced by the ten index member funds ranged from -10.42% to -16.55%, with four funds outperforming the -14.48% registered by the MSCI ACWI ex USA (net) Index.
The best and worst performing funds reflected contrasts in their portfolio allocations that likely contributed to their performance differential. The -10.42% achieved by the BMO Pyrford International Stock Fund I was likely influenced by its 4.47% cash position and higher than the average index exposure to greater Asia stocks at 40.97% even as the fund’s heavier 7.66% allocation to energy stocks detracted from March’s performance. At the other end of the range, the DFA International Sustainability Core 1 fund, -16.55% in March, maintained a lower than benchmark allotment to the energy sector at 1.70% but higher consumer cyclical sector allocation of 14.19%.
[1] While definitions continue to evolve, sustainable investing refers to a range of five overarching investing approaches or strategies that encompass: values-based investing, negative screening (exclusions), thematic and impact investing, ESG integration and shareholder/bondholder engagement and proxy voting. These are not mutually exclusive.
SUSTAIN Equity and Bond Fund Indices Performance: March 2020
The Bottom Line: Stocks and many bonds retreat in one of the most volatile months in stock market history. SUSTAIN equity indices beat their conventional benchmarks.
Share This Article:
The Bottom Line: Stocks and many bonds retreat in one of the most volatile months in stock market history. SUSTAIN equity indices beat their conventional benchmarks.
Stocks and many bond segments retreat in one of the most volatile months in stock market history
The month of March has been one of the most volatile in stock market history, as the world-wide corona virus pandemic produced a simultaneous health crisis, financial crisis and potentially widespread business failures. Of 22 trading days during the month of March, all but nine trading sessions, or 59%, recorded daily gains or declines greater than 4%. Refer to Chart 1. Four sessions experienced price gains or drops equal to or greater than 9%, a reflection of the uncertainty in estimating the economic toll of the crisis given the significant unknowns, such as how long the virus will take to be fully contained, the duration and severity of the economic disruption, the consequence on corporate earnings as well as the combined impact of government and Federal Reserve actions, to mention just a few of the uncertainties. The uncertainty induced volatilities could also be observed in the March returns across a variety of asset classes and security types that settled within a range that extended from a positive 21.77% recorded by 20+ US treasury bonds to a low of -66.46% registered by Nymex crude. The S&P 500 ended the month -12.4% lower as all sectors posted negative results ranging from -5.4% for Consumer Staples to -34.8% for the Energy sector. At the same time, the Dow Jones Industrial Average and the Nasdaq Composite gave up -13.6% and -10.0%, in that order. Small company stocks, as measured by the Russell 2000, recorded a decline of -21.7% while small cap value stocks performed even worse, giving up -24.7% versus -19.1% for growth stocks. In fact, value stocks across the market cap continuum trailed growth stocks by a range from 5.6% to 7.8% for midcap stocks.
Outside the US, equities in many markets performed even worse, with the MSCI ACWI ex USA giving up -14.5% whereas emerging markets dropped -15.4%. Europe retreated by -14.4% while Latin America was the worst performing region, posting a decline of -34.5%. China, which was reported to have arrested any new cases of Covid-19 and was trying to restore normal life, declined -6.6% and was best national performer in March.
As for bonds, while long-dated US Treasuries ended in strong positive territory, the Bloomberg Barclays US Aggregate Bond Index registered a slight -0.6% decline. Investment-grade corporate bonds and even municipal bonds registered declines of -6.6% and -3.6%, respectively, but at the same time high yield bonds dropped -11.5% and Caa rated bonds ended even lower at -18.4%.
From a debate that in February still focused on the likelihood of an extension to the current extended economic cycle, the conversation has now shifted to how steep the recession will be in the second quarter and whether it will extend into the third quarter. More remote and less frequently discussed, but not out of the question entirely, is the possibility of a depression. According to Moody’s Investors, the firm expects “G-20 real GDP to contract by 0.5% in 2020, followed by a pickup to 3.2% growth in 2021.” In November last year, before the emergence of the coronavirus, Moody’s was expecting G-20 economies to grow by 2.6% in 2020. At the same time, the impact of the coronavirus on emerging markets could be even more severe and the recovery might be slower. But the depth and duration of the recession will in large part depend on the extent to which governments step in to support to their economies to avert permanent damage to households and businesses. In the US, a $2 trillion federal stimulus package was approved by Congress on March 27 and signed into law. This combined with the unprecedented action taken by the Federal Reserve should help soften the blow. Outside the US, fiscal and monetary authorities have also adopted important policy measures to support their economies with a view toward sustaining households and businesses. That said, some economies that were struck by the pandemic before Europe and the US have begun the slow albeit uncertain recovery process. This is the case in China, for example, that is expected to experience growth of 3.3% in 2020 versus an estimated 6.1% in 2019.
Sustainable mutual funds and ETFs[1]: Average decline of -11.94% across all fund types
The expanding universe of sustainable mutual funds/share classes and ETFs, 4,223 in total, ranging from money market funds to bond funds to US equity and international funds, posted an average decline of -11.94% in March. Returns spanned a range of 42.74% that extended from a high of 2.42% to a low of -40.32%. Only 199 funds/share classes or 4.7% of all funds/share classes, mostly money market funds, posted positive returns. The three Sustainable (SUSTAIN) Indices, tracking large cap equity funds, bond funds and foreign funds, posted declines of -11.81%, -2.98% and -14.20%, in that order. The two equity fund indices outperformed their corresponding conventional securities market benchmarks.
Sustainable (SUSTAIN) Large Cap Equity Fund Index beats S&P 500 by 59 bps
For the second month in succession during the February-March downturn, the Sustainable (SUSTAIN) Large Cap Equity Fund Index beat the S&P 500 by 59 basis points (bps) in March as six funds outperformed the conventional benchmark. The SUSTAIN Large Cap Equity Fund Index also leads the S&P 500 for the first quarter and trailing 12-months but lags since the inception of the index as of December 31, 2016. Since that date, there have been eight months during which the stock market turned in negative results and the SUSTAIN Index has outperformed in five of the eight months. Refer to Table 1 and Chart 2.
Excepting for exposure to the Industrial sector that varied by slightly over 2%, sector allocations in the aggregate for the SUSTAIN Large Cap index members were largely aligned with the S&P 500. That said, variations across individual funds were, in some cases, extensive. For example, GMO Quality III maintained a 40% exposure to the technology sector which was perceived to be in a better position to whether the financial crisis with their higher cash hoards while also entirely avoiding the hard hit energy sector. Parnassus Core Equity was the only other fund to entirely avoid the energy sector while the other eight funds maintained exposures ranging from 1.37% to a high of 5.16% reported by ClearBridge Appreciation Fund A.
GMO Quality III and Pioneer A were the best performers, posting -9.05% and -9.22%, respectively. At the other end of the range, Neuberger Berman Sustainable Equity Fund Institutional brought up the rear. The fund’s 17.7% exposure to European stocks, which didn’t perform as well, may have been a contributing factor.
Sustainable (SUSTAIN) Bond Fund Index trails by a wide 2.39%
The Sustainable (SUSTAIN) Bond Fund Index recorded a -2.98% total return in March, lagging by 2.39% the -0.59% return recorded by the Bloomberg Barclays US Aggregate Bond Index. This was the widest gap between the two indices observed since launch of the SUSTAIN Bond Fund Index as of December 2017 and it came after the index posted 2 consecutive months of strong total returns, 2.04% in January and 1.5% in February. This was also an unusual outcome in March in that none of the 10 funds that make up the SUSTAIN Index managed to beat the conventional benchmark. Refer to Table 2 and Chart 3.
Fund returns ranged from -5.21% recorded by the Morgan Stanley Institutional Core Plus Fixed Income Fund Institutional to -1.5% delivered by Pax Core Bond Fund Institutional. While the effective durations of the two portfolios were not dissimilar, the higher credit quality of the Pax Core Bond Fund, with 95.1% of portfolio assets in BBB or better quality assets, likely served to bolster the fund’s performance in March.
Unrelated to performance, there were two name changes in March. TIAA-CREF Social Choice Bond Fund is now the TIAA-CREF Core Impact Bond and the BMO TCH Core Plus Bond Fund is now the BMO Core Plus Bond Fund. The funds’ investment objectives and sustainable investing approaches remain unchanged.
Sustainable (SUSTAIN) Foreign Equity Fund Index outperforms by 28 bps
Posting a -14.2% decline in March, the Sustainable (SUSTAIN) Foreign Equity Fund Index recorded its worst monthly total return since the start of its short period of calculation as of June 2019 and the third consecutive monthly negative return. On a positive note, the SUSTAIN Index outperformed its conventional counterpart, the MSCI ACWI ex USA (net), by 28 bps and also in each of the last individual three months. The SUSTAIN Foreign Equity Index now leads by 1.47% and 1.38% for the quarter as well as the eight months since inception. Refer to Table 3 and Chart 4.
Returns in March produced by the ten index member funds ranged from -10.42% to -16.55%, with four funds outperforming the -14.48% registered by the MSCI ACWI ex USA (net) Index.
The best and worst performing funds reflected contrasts in their portfolio allocations that likely contributed to their performance differential. The -10.42% achieved by the BMO Pyrford International Stock Fund I was likely influenced by its 4.47% cash position and higher than the average index exposure to greater Asia stocks at 40.97% even as the fund’s heavier 7.66% allocation to energy stocks detracted from March’s performance. At the other end of the range, the DFA International Sustainability Core 1 fund, -16.55% in March, maintained a lower than benchmark allotment to the energy sector at 1.70% but higher consumer cyclical sector allocation of 14.19%.
[1] While definitions continue to evolve, sustainable investing refers to a range of five overarching investing approaches or strategies that encompass: values-based investing, negative screening (exclusions), thematic and impact investing, ESG integration and shareholder/bondholder engagement and proxy voting. These are not mutually exclusive.
Sustainableinvest.com
Benefits
Free access to regularly updated original research and analysis focused exclusively on sustainable finance and investing, providing investors with the guidance needed to make informed investment decisions that align with their personal values and financial goals while also contributing to the advancement of positive long-term environmental and social outcomes.
By offering financial support for our current work, either in the form of a one-time or regular contributions, you help to defray some of the costs associated with conducting our research and analysis as well as to maintain the www.sustainablest.wpengine.com website.
Helping us to expand our research capabilities and offerings over time to cover additional relevant topics geared to sustainable investors.
Sign up to free newsletters.
By submitting this form, you are consenting to receive marketing emails from: . You can revoke your consent to receive emails at any time by using the SafeUnsubscribe® link, found at the bottom of every email. Emails are serviced by Constant Contact