The Bottom Line: SUSTAIN Bond Fund Index beats by wide 68 bps but domestic and foreign equity fund indices trail by 20 and 27 bps.
Stocks and bonds gain in June and post strong quarterly results
Ignoring the ravages of the COVID-19 pandemic that are still unfolding and focusing instead on the gradual progress made to contain and reverse the coronavirus pandemic, the barrage of fiscal and monetary stimulus programs and progress toward a breakthrough vaccine, the S&P 500 closed the month of June up 1.99% and registered a gain of 20.54% for the quarter. The NASDAQ Composite added 6.1% and 31% in the quarter. Small cap stocks outperformed large-caps over both intervals while growth stocks led their value counterparts. In fact, the S&P 500 Value Index registered a -1% decline in June. Outside the US, the MSCI All Country World, ex USA Index posted an increase of 4.5% in June and 16.1% in the quarter while emerging markets, led by China, Taiwan and Korea, registered strong gains ranging from 9.0% to 8.2%. Investment-grade intermediate bonds were up 0.6% in June and 6.1% year-to-date while high quality 20+ year government bonds were up 21.6% since the start of the year. Corporate credits led with a 1.8% gain in June but lagged behind Treasuries year-to-date at 4.8%.
Stocks shifted into positive territory only to slide back in line with the worsening course of the pandemic
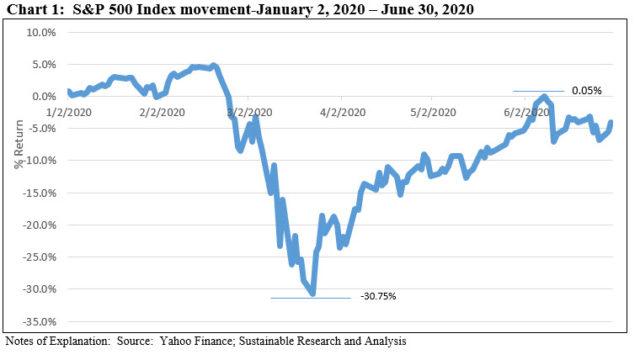
Since reaching its low point on March 23 at -30.75%, the broad stock market had been following an upward trajectory in line with the gradual progress made in the efforts to contain and reverse the coronavirus pandemic. As of June 8, the S&P 500 actually returned to positive territory when it achieved a year-to-date gain of 0.05%. Following that date, however, COVID-19 cases began to surge in some parts of the country and this began to force changes in the timelines of reopenings. Texas rolled back its reopening as coronavirus cases in the state climbed steeply and Florida suspended drinking at bars and also closed beaches ahead of the July 4th holiday weekend. Many states have seen surges in COVID-19 cases after reopening, leading state and city officials to re-impose restrictions or delay next steps. Apple Inc. shut 11 stores in Arizona, Florida, North Carolina and South Carolina after they had reopened and Disneyland in California announced that it was postponing a return to operations. The S&P 500 drifted steadily lower since June 8th, giving up 4.1% to end the year-to-June interval in the red at -3.08%. Refer to Chart 1.
Continued stock market volatility should be expected
The ravages of the COVID-19 pandemic are continuing to unfold and it may take years for the ultimate economic consequences to be fully tabulated. A V-shaped recovery appears too optimistic while the most pessimistic outcome would be a protracted contraction in Gross Domestic Product (GDP) which evolves into a depression with a period of high unemployment, a rash of business failures, and a permanent shift in consumer behavior. More likely is a prolonged U-shaped recovery in which the economy may not recover to pre-pandemic levels for at least several quarters. During this interval, continued stock market volatility should be expected.
ESG Performance Indicators
The universe of sustainable mutual funds and ETFs[1] across all asset classes and fund types, a total of 4,493 funds/share classes, gained an average 2.52% in June. Total returns ranged from a high of 27.59% recorded by the iPath Global Carbon ETN that provides exposure to the global price of carbon by referencing the price of carbon emissions credits from the world’s major emissions related mechanisms to a low of -6.21% posted by the AlphaCentric Energy Income Fund C, a thematic fund focusing on the infrastructure necessary to help drive the energy transition. At the same time, the S&P 500 ESG Index added 2.45% in June and 20.57% in the quarter. This compares to lower gains for the conventional S&P 500 Index as well as the Sustainable (SUSTAIN) Large Cap Equity Fund Index. As for bonds, the Bloomberg Barclays MSCI US ESG Aggregate Focus Index recorded a gain of 0.59% in June and 2.82% in Q2 while its non-ESG counterpart performed slightly better, adding 0.62% in June and 2.92% in the second quarter. By way of comparison, the Sustainable (SUSTAIN) Bond Fund Index recorded beats in June and Q2. Completing the picture is the MSCI ACWI ex USA ESG Leaders Index which gained 5.0%, outperforming its conventional counterpart by 8 bps and the Sustainable (SUSTAIN) Foreign Equity Fund Index by 27 bps.
Sustainable (SUSTAIN) Large Cap Equity Fund Index fell behind S&P 500 by 20 bps
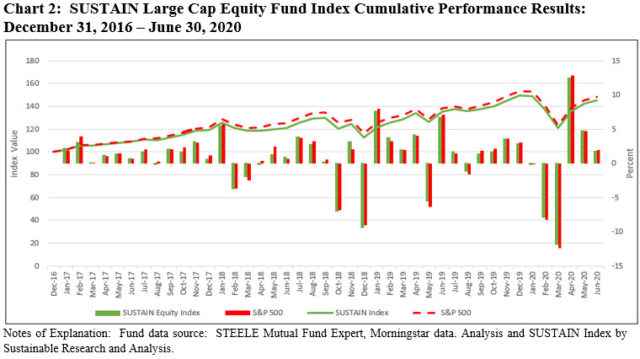
The Sustainable (SUSTAIN) Large Cap Equity Fund Index recorded a gain of 1.8% in June but underperformed the S&P 500 by 20 bps. It posted a very strong 19.9% increase in the second quarter and in the process erased its February-March decline of -18.8%. Still, the SUSTAIN Index was eclipsed by the S&P 500, up 20.5%, for a 66 bps drag. Since inception as of December 2016, the SUSTAIN Index trails by 3.4%. Refer to Table 1 and Chart 2.
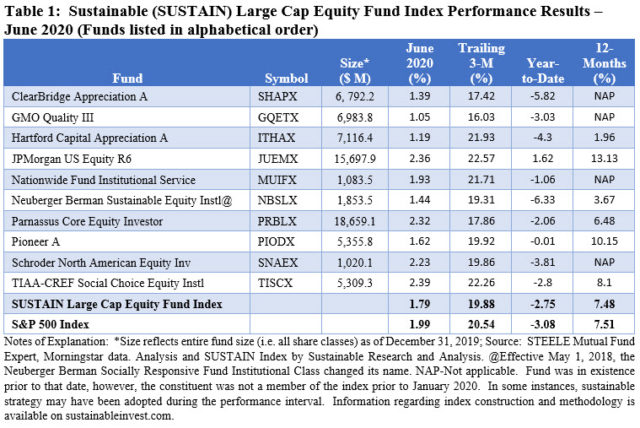
For the month of June, the SUSTAIN Fund Index benefited from the outperformance achieved by four of the 10 constituent funds, led by TIAA-CREF Social Choice Equity Fund Institutional that recorded a gain of 2.39% and JPMorgan US Equity R6, up 2.36%. The second best performer in June also posted the best second quarter return and is the only fund to register a year-to-date gain of 1.62%. The fund, which employs an ESG Integration strategy within the context of a research-driven approach that focuses on identifying the most undervalued stocks in each sector, maintains sector weightings similar to the S&P 500 Index.
Sustainable (SUSTAIN) Bond Fund Index beat the conventional index by 68 bps
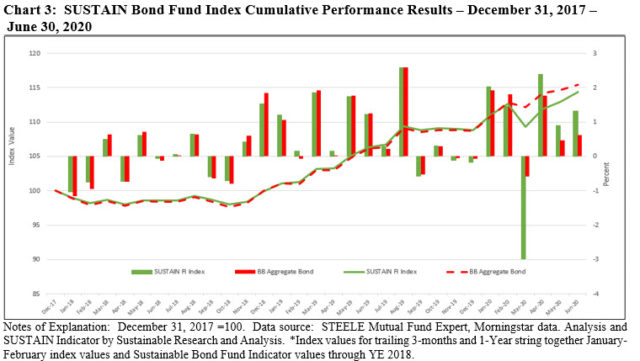
The SUSTAIN Bond Fund Index generated a 1.31% total return and exceeded the 0.63% outcome recorded by the Bloomberg Barclays US Aggregate Bond Fund Index, for a differential of 68 bps. This was the widest beat since the launch of the SUSTAIN Index as of December 31, 2017. All ten fund members outperformed the conventional benchmark, with returns ranging from a low of 0.8% by the PAX Core Bond Fund Institutional to a high of 1.87% recorded by the Calvert Bond Fund I. This $1.76 billion fund, which has grown to $1.84 billion since the start of the year, employs an ESG Mixed strategy that combines ESG integration, exclusions, and engagement. The fund benefited from its credit overweight during a month when US credit outperformed U.S. Treasuries. Refer to Table 2.
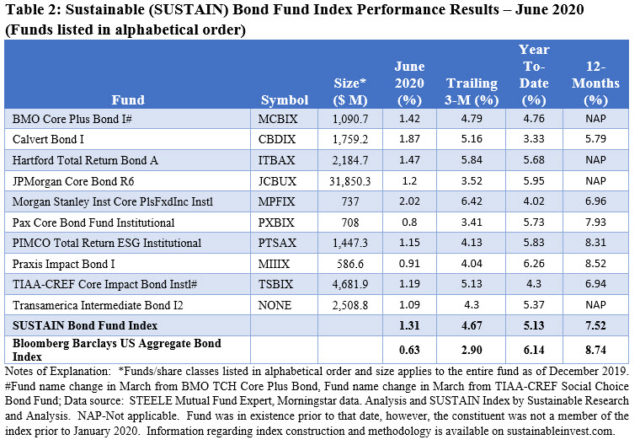
While the SUSTAIN Index also beat the Bloomberg Barclays US Aggregate Bond Fund Index in the second quarter, it lagged behind over the trailing 12-months as well as since inception by 1.22% and 1.02% respectively. Refer to Chart 3.
Sustainable (SUSTAIN) Foreign Equity Fund Index lagged the conventional benchmark by 27 bps
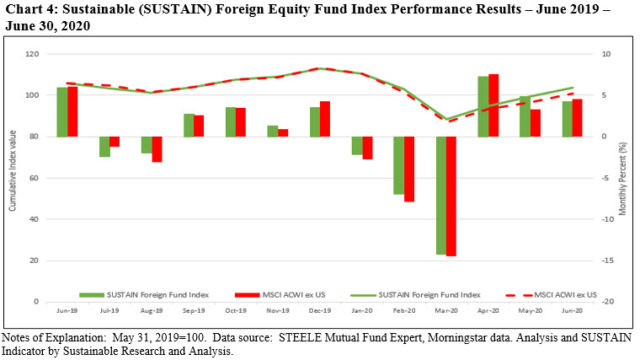
The SUSTAIN Foreign Equity Fund Index posted a gain of 4.25%, registering a third consecutive monthly gain and almost erasing the -20.2% decline suffered during the February-March market meltdown with a three-month increase of 17.3%. Still, the SUSTAIN Index lagged the MSCI ACWI, ex USA by 27 bps in June while leading the conventional index over the trailing two months by giving up -2.22% while the conventional index was down -4.80%. Refer to Table 3.
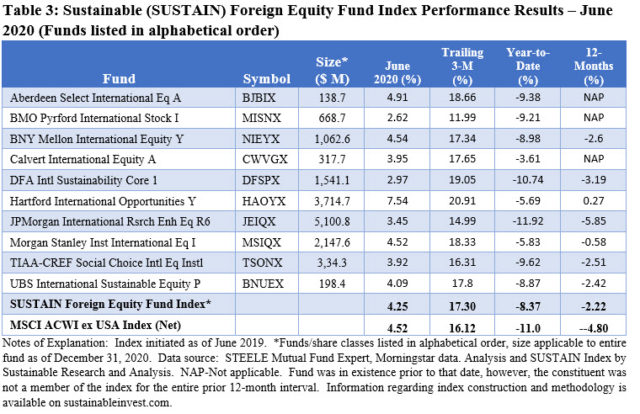
Four funds recorded gains equal to or greater than the 4.52% achieved by the MSCI Index, led by Hartford International Opportunities Fund Y, up 7.54%. The fund employs a bottom-up stock selection process that combines ESG Integration to inform the resultant sector allocation. Its June performance contributed to the fund’s positive 0.27% return over the trailing 12-months—the only index member for the entire term that posted a positive result over this time interval. Refer to Chart 4.
[1] While definitions continue to evolve, sustainable investing refers to a range of five overarching investing approaches or strategies that encompass: values-based investing, negative screening (exclusions), thematic and impact investing and ESG integration. These are not mutually exclusive and shareholder/bondholder engagement and proxy voting may be also be employed by any of the foregoing strategies.
SUSTAIN Bond Fund Index shines while equity fund indices lag in June
The Bottom Line: SUSTAIN Bond Fund Index beats by wide 68 bps but domestic and foreign equity fund indices trail by 20 and 27 bps.
Share This Article:
The Bottom Line: SUSTAIN Bond Fund Index beats by wide 68 bps but domestic and foreign equity fund indices trail by 20 and 27 bps.
Stocks and bonds gain in June and post strong quarterly results
Ignoring the ravages of the COVID-19 pandemic that are still unfolding and focusing instead on the gradual progress made to contain and reverse the coronavirus pandemic, the barrage of fiscal and monetary stimulus programs and progress toward a breakthrough vaccine, the S&P 500 closed the month of June up 1.99% and registered a gain of 20.54% for the quarter. The NASDAQ Composite added 6.1% and 31% in the quarter. Small cap stocks outperformed large-caps over both intervals while growth stocks led their value counterparts. In fact, the S&P 500 Value Index registered a -1% decline in June. Outside the US, the MSCI All Country World, ex USA Index posted an increase of 4.5% in June and 16.1% in the quarter while emerging markets, led by China, Taiwan and Korea, registered strong gains ranging from 9.0% to 8.2%. Investment-grade intermediate bonds were up 0.6% in June and 6.1% year-to-date while high quality 20+ year government bonds were up 21.6% since the start of the year. Corporate credits led with a 1.8% gain in June but lagged behind Treasuries year-to-date at 4.8%.
Stocks shifted into positive territory only to slide back in line with the worsening course of the pandemic
Since reaching its low point on March 23 at -30.75%, the broad stock market had been following an upward trajectory in line with the gradual progress made in the efforts to contain and reverse the coronavirus pandemic. As of June 8, the S&P 500 actually returned to positive territory when it achieved a year-to-date gain of 0.05%. Following that date, however, COVID-19 cases began to surge in some parts of the country and this began to force changes in the timelines of reopenings. Texas rolled back its reopening as coronavirus cases in the state climbed steeply and Florida suspended drinking at bars and also closed beaches ahead of the July 4th holiday weekend. Many states have seen surges in COVID-19 cases after reopening, leading state and city officials to re-impose restrictions or delay next steps. Apple Inc. shut 11 stores in Arizona, Florida, North Carolina and South Carolina after they had reopened and Disneyland in California announced that it was postponing a return to operations. The S&P 500 drifted steadily lower since June 8th, giving up 4.1% to end the year-to-June interval in the red at -3.08%. Refer to Chart 1.

Continued stock market volatility should be expected
The ravages of the COVID-19 pandemic are continuing to unfold and it may take years for the ultimate economic consequences to be fully tabulated. A V-shaped recovery appears too optimistic while the most pessimistic outcome would be a protracted contraction in Gross Domestic Product (GDP) which evolves into a depression with a period of high unemployment, a rash of business failures, and a permanent shift in consumer behavior. More likely is a prolonged U-shaped recovery in which the economy may not recover to pre-pandemic levels for at least several quarters. During this interval, continued stock market volatility should be expected.
ESG Performance Indicators
The universe of sustainable mutual funds and ETFs[1] across all asset classes and fund types, a total of 4,493 funds/share classes, gained an average 2.52% in June. Total returns ranged from a high of 27.59% recorded by the iPath Global Carbon ETN that provides exposure to the global price of carbon by referencing the price of carbon emissions credits from the world’s major emissions related mechanisms to a low of -6.21% posted by the AlphaCentric Energy Income Fund C, a thematic fund focusing on the infrastructure necessary to help drive the energy transition. At the same time, the S&P 500 ESG Index added 2.45% in June and 20.57% in the quarter. This compares to lower gains for the conventional S&P 500 Index as well as the Sustainable (SUSTAIN) Large Cap Equity Fund Index. As for bonds, the Bloomberg Barclays MSCI US ESG Aggregate Focus Index recorded a gain of 0.59% in June and 2.82% in Q2 while its non-ESG counterpart performed slightly better, adding 0.62% in June and 2.92% in the second quarter. By way of comparison, the Sustainable (SUSTAIN) Bond Fund Index recorded beats in June and Q2. Completing the picture is the MSCI ACWI ex USA ESG Leaders Index which gained 5.0%, outperforming its conventional counterpart by 8 bps and the Sustainable (SUSTAIN) Foreign Equity Fund Index by 27 bps.
Sustainable (SUSTAIN) Large Cap Equity Fund Index fell behind S&P 500 by 20 bps
The Sustainable (SUSTAIN) Large Cap Equity Fund Index recorded a gain of 1.8% in June but underperformed the S&P 500 by 20 bps. It posted a very strong 19.9% increase in the second quarter and in the process erased its February-March decline of -18.8%. Still, the SUSTAIN Index was eclipsed by the S&P 500, up 20.5%, for a 66 bps drag. Since inception as of December 2016, the SUSTAIN Index trails by 3.4%. Refer to Table 1 and Chart 2.


For the month of June, the SUSTAIN Fund Index benefited from the outperformance achieved by four of the 10 constituent funds, led by TIAA-CREF Social Choice Equity Fund Institutional that recorded a gain of 2.39% and JPMorgan US Equity R6, up 2.36%. The second best performer in June also posted the best second quarter return and is the only fund to register a year-to-date gain of 1.62%. The fund, which employs an ESG Integration strategy within the context of a research-driven approach that focuses on identifying the most undervalued stocks in each sector, maintains sector weightings similar to the S&P 500 Index.
Sustainable (SUSTAIN) Bond Fund Index beat the conventional index by 68 bps
The SUSTAIN Bond Fund Index generated a 1.31% total return and exceeded the 0.63% outcome recorded by the Bloomberg Barclays US Aggregate Bond Fund Index, for a differential of 68 bps. This was the widest beat since the launch of the SUSTAIN Index as of December 31, 2017. All ten fund members outperformed the conventional benchmark, with returns ranging from a low of 0.8% by the PAX Core Bond Fund Institutional to a high of 1.87% recorded by the Calvert Bond Fund I. This $1.76 billion fund, which has grown to $1.84 billion since the start of the year, employs an ESG Mixed strategy that combines ESG integration, exclusions, and engagement. The fund benefited from its credit overweight during a month when US credit outperformed U.S. Treasuries. Refer to Table 2.


While the SUSTAIN Index also beat the Bloomberg Barclays US Aggregate Bond Fund Index in the second quarter, it lagged behind over the trailing 12-months as well as since inception by 1.22% and 1.02% respectively. Refer to Chart 3.
Sustainable (SUSTAIN) Foreign Equity Fund Index lagged the conventional benchmark by 27 bps
The SUSTAIN Foreign Equity Fund Index posted a gain of 4.25%, registering a third consecutive monthly gain and almost erasing the -20.2% decline suffered during the February-March market meltdown with a three-month increase of 17.3%. Still, the SUSTAIN Index lagged the MSCI ACWI, ex USA by 27 bps in June while leading the conventional index over the trailing two months by giving up -2.22% while the conventional index was down -4.80%. Refer to Table 3.


Four funds recorded gains equal to or greater than the 4.52% achieved by the MSCI Index, led by Hartford International Opportunities Fund Y, up 7.54%. The fund employs a bottom-up stock selection process that combines ESG Integration to inform the resultant sector allocation. Its June performance contributed to the fund’s positive 0.27% return over the trailing 12-months—the only index member for the entire term that posted a positive result over this time interval. Refer to Chart 4.
[1] While definitions continue to evolve, sustainable investing refers to a range of five overarching investing approaches or strategies that encompass: values-based investing, negative screening (exclusions), thematic and impact investing and ESG integration. These are not mutually exclusive and shareholder/bondholder engagement and proxy voting may be also be employed by any of the foregoing strategies.
Sustainableinvest.com
Benefits
Free access to regularly updated original research and analysis focused exclusively on sustainable finance and investing, providing investors with the guidance needed to make informed investment decisions that align with their personal values and financial goals while also contributing to the advancement of positive long-term environmental and social outcomes.
By offering financial support for our current work, either in the form of a one-time or regular contributions, you help to defray some of the costs associated with conducting our research and analysis as well as to maintain the www.sustainablest.wpengine.com website.
Helping us to expand our research capabilities and offerings over time to cover additional relevant topics geared to sustainable investors.
Sign up to free newsletters.
By submitting this form, you are consenting to receive marketing emails from: . You can revoke your consent to receive emails at any time by using the SafeUnsubscribe® link, found at the bottom of every email. Emails are serviced by Constant Contact