October Summary
An abrupt shift in sentiment and momentum moved the S&P 500 Index down -6.84% in October to register not only its third loss so far this year but also the biggest monthly decline since September 2011. During the same interval, the Sustainable (SUSTAIN) Large Cap Equity Fund Index posted a drop of -7.0%. This is the steepest drop since calculation of the SUSTAIN Index commenced as of December 31, 2016. The broad bond market also ended lower, but registered a limited -0.79% decline that was slightly beaten by sustainable fixed income funds.
Investors pivoted from positive to negative on the sustainability of the 9 year old bull market
Investors pivoted from positive to negative on the sustainability of the nine-year old bull market, focusing instead on a range of new as well as continuing concerns, from geopolitical risks, such as recent events in Saudi Arabia, Italy, Turkey, and even Germany, to local political anxieties in the US and uncertainties heading into the November 6th mid-term elections, to economic considerations, including the unresolved trade dispute with China, the slowing Chinese economy, inflation as well as interest rate jitters. Perhaps most importantly, however, the reversal may be reflecting tempered investor expectations with regard to corporate earnings. For the third quarter through the end of October, with about 74% of the companies in the S&P 500 reporting actual financial results combined with estimated results for companies that had yet to report, the year-over-year earnings growth rate for the third quarter, according to FactSet Research, stood at 24.9% which is above the estimate of 19.3% at the end of the quarter. At this level, the growth rate for the third quarter will be the second highest earnings growth rate since third quarter 2010. But looking ahead, a slightly slower earnings growth rate of 21% is projected for the fourth quarter 2018 and a more moderate 9% growth rate in calendar year 2019.
After peeking on September 20, 2018, the S&P 500 reversed course and came within 12 basis points (bps) on October 29th of moving into correction territory. Positive returns recorded on both October 30 and October 31, during which index gained 2.7%, averted this outcome. All but two S&P sectors scored positive results. These include the defensive Utilities and Consumer Staples sectors that were up 3.09% and 3.01%, respectively. The eight remaining sectors suffered declines ranging from -0.37% recorded by the Real Estate sector, -11.86% posted by the Energy sector and -12.75% sustained by the Consumer Discretionary sector.
While the S&P 500 gave up 6.84%, the Dow Jones Industrial Index dropped -5.1% in its biggest monthly percentage fall since January 2016. The technology heavy Nasdaq was the worst-performing major benchmark, dropping -9.2% in October for the biggest fall since November 2008. The performance of technology stocks also dragged down large cap growth oriented indexes that posted steeper declines relative to value oriented benchmarks. The S&P 500 Growth Index, for example, was down -8.08% while its value counterpart was down -5.33%, for a difference of 275 basis points. Stocks outside the US were also trading at some of the lowest valuations in more than 2-years. Latin America was the exception in October, recording an outlier gain of 3.46%, according to the MSCI Emerging Markets Latin America Index versus other geographic regions. Optimism over presidential elections in Brazil, an International Monetary Fund funding facility for recession-hit Argentina, and a new trade deal between Mexico, the United States and Canada seemed to carve out the region from concerns about global growth and trade that punished other emerging markets. The MSCI Emerging Markets Asia Index registered a decline of -10.92% while MSCI China was down -11.47%
Fixed income investors were not spared as bonds didn’t offer any ballast during the turmoil
Fixed income investors were not spared as bonds didn’t offer any ballast during the turmoil. Intermediate-term investment grade bonds, as measure by the Bloomberg Barclays US Aggregate Index posted a decline of -0.79% on the back of rising rates, as 10-Year Treasury yields moved up by 10 basis points from 3.05% to 3.15% at October 31st. On the other hand, 90-day Treasury Bills posted a gain of 0.19%.
For the third month in a row, the SUSTAIN Large Cap Equity Fund Index lagged behind the S&P 500 by a slight margin of 17 basis points after posting its -7.0% decline
For the third month in a row, the SUSTAIN Large Cap Equity Fund Index lagged behind the S&P 500 by a slight margin of 17 basis points after posting its -7.0% decline. Only four of the ten funds outperformed the conventional S&P 500, led by Calvert Equity A that recorded a drop of -4.53% relative to the next best performing fund, the Parnassus Core Equity Investor, down -5.35%. Refer to Table 1. Calvert Equity A led for the second month in a row and is the only fund posting a double digit total return for the twelve month period. The fund’s 13.51% return achieved over the last year exceeds the performance of the S&P 500 by 6.16%. Sector allocation decisions contributed to the month’s results, such as favoring the Consumer Staples sector, one of only two sectors, as noted above, to record a gain or avoiding the Energy sector. Stock selection decisions also contributed to the month’s results, including judgments not to hold Facebook, Inc. (FB), Apple, Inc. (AAPL) or Amazon.com (AMZN) due to valuation concerns as well as social concerns around the adequacy of controls protecting the privacy of data and data security.
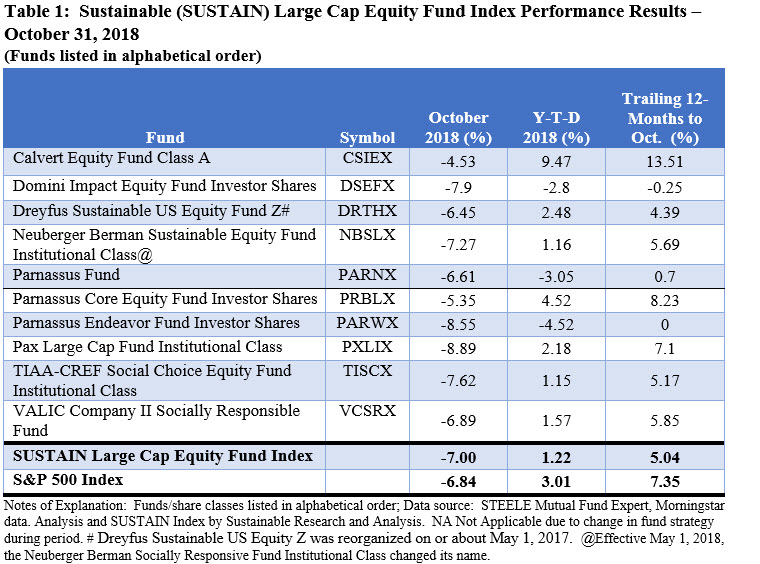
While between 82 basis points and 208 basis points separate them on the basis of performance results in October, Parnassus Core Equity Investor Shares, Dreyfus Sustainable US Equity Z and VALIC Company II Socially Responsible also exceeded the performance of the S&P 500.
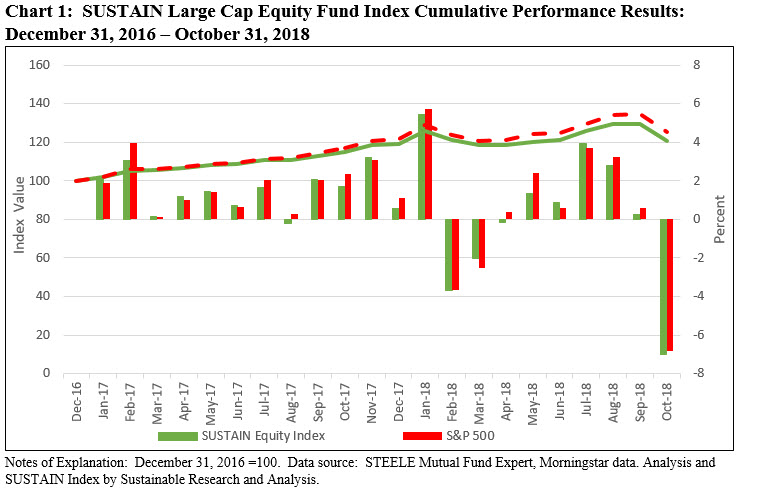
Since its inception as of December 31, 2016, the SUSTAIN Large Cap Equity Fund Index trails the S&P 500 by 4.89%. Refer to Chart 1.
Higher cash position didn’t correlate with October’s returns
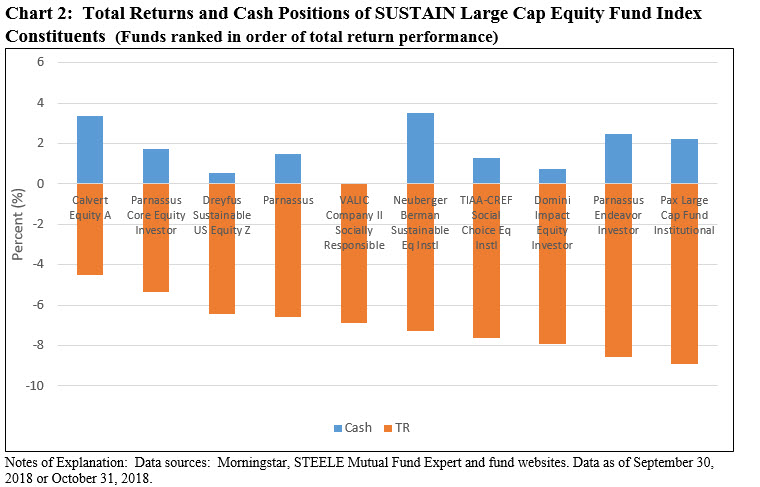
During a month when the S&P 500 posted 16 declines, or 70% of the time over the month’s 23 trading days, and a cumulative -6.84% drop, maintaining a cash position, even at 3.38%, also contributed to the Calvert Equity Fund’s above index results. This level of cash, in excess of the average 1.7% cash position maintained by the ten SUSTAIN Index funds, was the second highest, eclipsed only by the 3.52% cash position reported by the Neuberger Berman Sustainable Equity Fund. That said, a higher cash position didn’t correlate with October’s returns. Refer to Chart 2.
Pax Larger Cap Fund Institutional Shares recorded a decline of -8.89
At the other end of the range, Pax Larger Cap Fund Institutional Shares, recorded a decline of -8.89%. The fund’s neutral sector positioning but orientation toward growth stocks with its heavier weightings in stocks such as Microsoft Corp. (MSFT), 5.35%, Amazon.com (AMZN), 4.85%, and Apple (AAPL), 3.84%, likely pushed the fund’s performance to the lower end of the range.
The Sustainable (SUSTAIN) Bond Fund Indicator outperformed the conventional index by 9 basis points to end the month
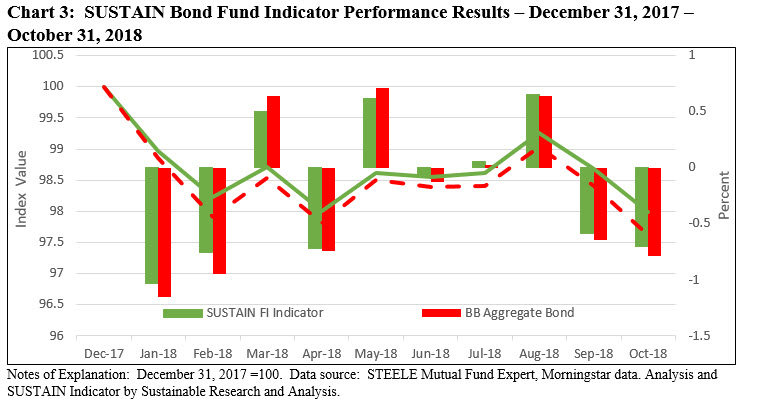
Against a backdrop of concerns about US inflation and interest rates, 10-Year Treasury yields moved up by 10 basis points from 3.05% to 3.15% at October 31st and the Bloomberg Barclays US Aggregate Index posted a decline of -0.79%. This was the benchmark’s sixth monthly drop so far this year and the third worst, bringing the year-to-date performance to a negative -2.38%. The Sustainable (SUSTAIN) Bond Fund Indicator moved lower as well, but outperformed the conventional index by 9 basis points to end the month 0.70% lower while also continuing to exceed the Bloomberg Barclays US Aggregate Index by increasing margins on a year-to-date and trailing twelve-month basis with its returns of -1.19% and -1.72%, respectively. Refer to Table 2 and Chart 3.
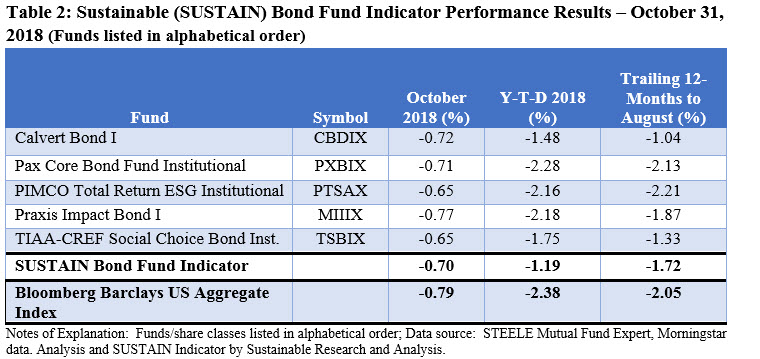
Each of the five funds outperformed the conventional benchmark, led by PIMCO Total Return ESG Institutional Fund and TIAA-CREF Social Choice Bond Fund Institutional Shares, as both funds posted declines of -0.65% while TIAA-CREF leads over the trailing 12-months. That said, the two funds arrived at their results via varying strategies that extend beyond their approaches to sustainable investing but that can also contribute or detract from the results (for details regarding each fund’s sustainable investing strategies, click on the website’s Investment Research tab and proceed to The Basics tab and then Sustainable Investment Glossary). Based on the most recent data, in the case of TIAA-CREF, the fund invests 86.73% of its assets in US bonds, it maintained a slightly longer duration (5.77), and lower concentration of AAA rated securities (40.96%) likely linked to its significantly lower exposure to agency MBS Pass-Through securities (22.83%) and allocated 11.26% investments in municipal securities. This compares to PIMCO’s 76% investments in US bonds, a duration of 4.09, a 48.23% allocation to AAA rated securities and 74.44% investments in MBS Pass-Through bonds that may be largely supported by reliance on various derivative positions given the reported -33.24% cash holding.
__________________________________________
Sustainable (SUSTAIN) Large Cap Equity Fund Index Explained
The index, which was initiated as of June 30, 2017 with data back to December 31, 2016, tracks the total return performance of the ten largest actively managed large cap domestic equity mutual funds that employ a sustainable investment strategy beyond absolute reliance on exclusionary practices for religious, ethical or social reasons. While methodologies vary, to qualify for inclusion in the index, funds in excess of $50 million in net assets must actively apply environmental, social and governance (ESG) criteria to their investment processes and decision making. In tandem with their ESG integration strategy, funds may also employ exclusionary strategies along with impact oriented investment approaches as well as shareholder advocacy. Multiple funds managed by the same management firm may be included in the index, however, a fund with multiple share classes is only included in the index once, based on the largest share class in terms of assets. The index is equally weighted, it is calculated monthly and rebalanced once a year as of December 31. The combined assets associated with the ten funds stood at $21.2 billion and represent about 13.7% of the entire sustainable US equity sector that is comprised of 220 funds/share classes, including actively managed funds and index funds, with $154.4 billion in assets under management.
Sustainable (SUSTAIN) Bond Fund Indicator Explained
This benchmark, which was initiated as of December 31, 2017, tracks the total return performance of the five largest actively managed investment-grade intermediate term bond mutual funds that employ a sustainable investment strategy beyond absolute reliance on exclusionary practices for religious, ethical or social reasons. While methodologies vary, to qualify for inclusion in the benchmark, funds in excess of $50 million in net assets must actively apply environmental, social and governance (ESG) criteria to their investment processes and decision making. In tandem with their ESG integration strategy, funds may also employ exclusionary strategies, impact oriented investment approaches as well as issuer-oriented advocacy. Multiple funds managed by the same management firm may be included in the benchmark, however, a fund with multiple share classes is only included once, based on the largest share class in terms of assets. The indicator is equally weighted, it is calculated monthly and rebalanced once a year as of December 31. At the time it was constructed as of December 31, 2017 less than 10 funds qualified under the criteria set forth above and for this reason to distinguish this measure from a more robust one in terms of number of constituent funds, the benchmark is referred to as an indicator rather than an index. The combined assets associated with the five funds stood at $2.7 billion and these funds account for 15.3% of the entire sustainable US taxable fixed income sector that is comprised of 109 funds/share classes, including actively managed funds and index funds for a total of $17.8 billion in assets under management.
Abrupt Shift in Sentiment Also Impacts Sustainable Equity Funds in October
October Summary An abrupt shift in sentiment and momentum moved the S&P 500 Index down -6.84% in October to register not only its third loss so far this year but also the biggest monthly decline since September 2011. During the same interval, the Sustainable (SUSTAIN) Large Cap Equity Fund Index posted a drop of -7.0%. …
Share This Article:
October Summary
An abrupt shift in sentiment and momentum moved the S&P 500 Index down -6.84% in October to register not only its third loss so far this year but also the biggest monthly decline since September 2011. During the same interval, the Sustainable (SUSTAIN) Large Cap Equity Fund Index posted a drop of -7.0%. This is the steepest drop since calculation of the SUSTAIN Index commenced as of December 31, 2016. The broad bond market also ended lower, but registered a limited -0.79% decline that was slightly beaten by sustainable fixed income funds.
Investors pivoted from positive to negative on the sustainability of the 9 year old bull market
Investors pivoted from positive to negative on the sustainability of the nine-year old bull market, focusing instead on a range of new as well as continuing concerns, from geopolitical risks, such as recent events in Saudi Arabia, Italy, Turkey, and even Germany, to local political anxieties in the US and uncertainties heading into the November 6th mid-term elections, to economic considerations, including the unresolved trade dispute with China, the slowing Chinese economy, inflation as well as interest rate jitters. Perhaps most importantly, however, the reversal may be reflecting tempered investor expectations with regard to corporate earnings. For the third quarter through the end of October, with about 74% of the companies in the S&P 500 reporting actual financial results combined with estimated results for companies that had yet to report, the year-over-year earnings growth rate for the third quarter, according to FactSet Research, stood at 24.9% which is above the estimate of 19.3% at the end of the quarter. At this level, the growth rate for the third quarter will be the second highest earnings growth rate since third quarter 2010. But looking ahead, a slightly slower earnings growth rate of 21% is projected for the fourth quarter 2018 and a more moderate 9% growth rate in calendar year 2019.
After peeking on September 20, 2018, the S&P 500 reversed course and came within 12 basis points (bps) on October 29th of moving into correction territory. Positive returns recorded on both October 30 and October 31, during which index gained 2.7%, averted this outcome. All but two S&P sectors scored positive results. These include the defensive Utilities and Consumer Staples sectors that were up 3.09% and 3.01%, respectively. The eight remaining sectors suffered declines ranging from -0.37% recorded by the Real Estate sector, -11.86% posted by the Energy sector and -12.75% sustained by the Consumer Discretionary sector.
While the S&P 500 gave up 6.84%, the Dow Jones Industrial Index dropped -5.1% in its biggest monthly percentage fall since January 2016. The technology heavy Nasdaq was the worst-performing major benchmark, dropping -9.2% in October for the biggest fall since November 2008. The performance of technology stocks also dragged down large cap growth oriented indexes that posted steeper declines relative to value oriented benchmarks. The S&P 500 Growth Index, for example, was down -8.08% while its value counterpart was down -5.33%, for a difference of 275 basis points. Stocks outside the US were also trading at some of the lowest valuations in more than 2-years. Latin America was the exception in October, recording an outlier gain of 3.46%, according to the MSCI Emerging Markets Latin America Index versus other geographic regions. Optimism over presidential elections in Brazil, an International Monetary Fund funding facility for recession-hit Argentina, and a new trade deal between Mexico, the United States and Canada seemed to carve out the region from concerns about global growth and trade that punished other emerging markets. The MSCI Emerging Markets Asia Index registered a decline of -10.92% while MSCI China was down -11.47%
Fixed income investors were not spared as bonds didn’t offer any ballast during the turmoil
Fixed income investors were not spared as bonds didn’t offer any ballast during the turmoil. Intermediate-term investment grade bonds, as measure by the Bloomberg Barclays US Aggregate Index posted a decline of -0.79% on the back of rising rates, as 10-Year Treasury yields moved up by 10 basis points from 3.05% to 3.15% at October 31st. On the other hand, 90-day Treasury Bills posted a gain of 0.19%.
For the third month in a row, the SUSTAIN Large Cap Equity Fund Index lagged behind the S&P 500 by a slight margin of 17 basis points after posting its -7.0% decline
For the third month in a row, the SUSTAIN Large Cap Equity Fund Index lagged behind the S&P 500 by a slight margin of 17 basis points after posting its -7.0% decline. Only four of the ten funds outperformed the conventional S&P 500, led by Calvert Equity A that recorded a drop of -4.53% relative to the next best performing fund, the Parnassus Core Equity Investor, down -5.35%. Refer to Table 1. Calvert Equity A led for the second month in a row and is the only fund posting a double digit total return for the twelve month period. The fund’s 13.51% return achieved over the last year exceeds the performance of the S&P 500 by 6.16%. Sector allocation decisions contributed to the month’s results, such as favoring the Consumer Staples sector, one of only two sectors, as noted above, to record a gain or avoiding the Energy sector. Stock selection decisions also contributed to the month’s results, including judgments not to hold Facebook, Inc. (FB), Apple, Inc. (AAPL) or Amazon.com (AMZN) due to valuation concerns as well as social concerns around the adequacy of controls protecting the privacy of data and data security.
While between 82 basis points and 208 basis points separate them on the basis of performance results in October, Parnassus Core Equity Investor Shares, Dreyfus Sustainable US Equity Z and VALIC Company II Socially Responsible also exceeded the performance of the S&P 500.
Since its inception as of December 31, 2016, the SUSTAIN Large Cap Equity Fund Index trails the S&P 500 by 4.89%. Refer to Chart 1.
Higher cash position didn’t correlate with October’s returns
During a month when the S&P 500 posted 16 declines, or 70% of the time over the month’s 23 trading days, and a cumulative -6.84% drop, maintaining a cash position, even at 3.38%, also contributed to the Calvert Equity Fund’s above index results. This level of cash, in excess of the average 1.7% cash position maintained by the ten SUSTAIN Index funds, was the second highest, eclipsed only by the 3.52% cash position reported by the Neuberger Berman Sustainable Equity Fund. That said, a higher cash position didn’t correlate with October’s returns. Refer to Chart 2.
Pax Larger Cap Fund Institutional Shares recorded a decline of -8.89
At the other end of the range, Pax Larger Cap Fund Institutional Shares, recorded a decline of -8.89%. The fund’s neutral sector positioning but orientation toward growth stocks with its heavier weightings in stocks such as Microsoft Corp. (MSFT), 5.35%, Amazon.com (AMZN), 4.85%, and Apple (AAPL), 3.84%, likely pushed the fund’s performance to the lower end of the range.
The Sustainable (SUSTAIN) Bond Fund Indicator outperformed the conventional index by 9 basis points to end the month
Against a backdrop of concerns about US inflation and interest rates, 10-Year Treasury yields moved up by 10 basis points from 3.05% to 3.15% at October 31st and the Bloomberg Barclays US Aggregate Index posted a decline of -0.79%. This was the benchmark’s sixth monthly drop so far this year and the third worst, bringing the year-to-date performance to a negative -2.38%. The Sustainable (SUSTAIN) Bond Fund Indicator moved lower as well, but outperformed the conventional index by 9 basis points to end the month 0.70% lower while also continuing to exceed the Bloomberg Barclays US Aggregate Index by increasing margins on a year-to-date and trailing twelve-month basis with its returns of -1.19% and -1.72%, respectively. Refer to Table 2 and Chart 3.
Each of the five funds outperformed the conventional benchmark, led by PIMCO Total Return ESG Institutional Fund and TIAA-CREF Social Choice Bond Fund Institutional Shares, as both funds posted declines of -0.65% while TIAA-CREF leads over the trailing 12-months. That said, the two funds arrived at their results via varying strategies that extend beyond their approaches to sustainable investing but that can also contribute or detract from the results (for details regarding each fund’s sustainable investing strategies, click on the website’s Investment Research tab and proceed to The Basics tab and then Sustainable Investment Glossary). Based on the most recent data, in the case of TIAA-CREF, the fund invests 86.73% of its assets in US bonds, it maintained a slightly longer duration (5.77), and lower concentration of AAA rated securities (40.96%) likely linked to its significantly lower exposure to agency MBS Pass-Through securities (22.83%) and allocated 11.26% investments in municipal securities. This compares to PIMCO’s 76% investments in US bonds, a duration of 4.09, a 48.23% allocation to AAA rated securities and 74.44% investments in MBS Pass-Through bonds that may be largely supported by reliance on various derivative positions given the reported -33.24% cash holding.
__________________________________________
Sustainable (SUSTAIN) Large Cap Equity Fund Index Explained
The index, which was initiated as of June 30, 2017 with data back to December 31, 2016, tracks the total return performance of the ten largest actively managed large cap domestic equity mutual funds that employ a sustainable investment strategy beyond absolute reliance on exclusionary practices for religious, ethical or social reasons. While methodologies vary, to qualify for inclusion in the index, funds in excess of $50 million in net assets must actively apply environmental, social and governance (ESG) criteria to their investment processes and decision making. In tandem with their ESG integration strategy, funds may also employ exclusionary strategies along with impact oriented investment approaches as well as shareholder advocacy. Multiple funds managed by the same management firm may be included in the index, however, a fund with multiple share classes is only included in the index once, based on the largest share class in terms of assets. The index is equally weighted, it is calculated monthly and rebalanced once a year as of December 31. The combined assets associated with the ten funds stood at $21.2 billion and represent about 13.7% of the entire sustainable US equity sector that is comprised of 220 funds/share classes, including actively managed funds and index funds, with $154.4 billion in assets under management.
Sustainable (SUSTAIN) Bond Fund Indicator Explained
This benchmark, which was initiated as of December 31, 2017, tracks the total return performance of the five largest actively managed investment-grade intermediate term bond mutual funds that employ a sustainable investment strategy beyond absolute reliance on exclusionary practices for religious, ethical or social reasons. While methodologies vary, to qualify for inclusion in the benchmark, funds in excess of $50 million in net assets must actively apply environmental, social and governance (ESG) criteria to their investment processes and decision making. In tandem with their ESG integration strategy, funds may also employ exclusionary strategies, impact oriented investment approaches as well as issuer-oriented advocacy. Multiple funds managed by the same management firm may be included in the benchmark, however, a fund with multiple share classes is only included once, based on the largest share class in terms of assets. The indicator is equally weighted, it is calculated monthly and rebalanced once a year as of December 31. At the time it was constructed as of December 31, 2017 less than 10 funds qualified under the criteria set forth above and for this reason to distinguish this measure from a more robust one in terms of number of constituent funds, the benchmark is referred to as an indicator rather than an index. The combined assets associated with the five funds stood at $2.7 billion and these funds account for 15.3% of the entire sustainable US taxable fixed income sector that is comprised of 109 funds/share classes, including actively managed funds and index funds for a total of $17.8 billion in assets under management.
Sustainableinvest.com
Benefits
Free access to regularly updated original research and analysis focused exclusively on sustainable finance and investing, providing investors with the guidance needed to make informed investment decisions that align with their personal values and financial goals while also contributing to the advancement of positive long-term environmental and social outcomes.
By offering financial support for our current work, either in the form of a one-time or regular contributions, you help to defray some of the costs associated with conducting our research and analysis as well as to maintain the www.sustainablest.wpengine.com website.
Helping us to expand our research capabilities and offerings over time to cover additional relevant topics geared to sustainable investors.
Sign up to free newsletters.
By submitting this form, you are consenting to receive marketing emails from: . You can revoke your consent to receive emails at any time by using the SafeUnsubscribe® link, found at the bottom of every email. Emails are serviced by Constant Contact