

The Bottom Line: Green bond funds ended October with $1.43 billion in assets and the Glasgow Climate Pact will stimulate issuance of more sustainable bonds.
Growth in green bond fund assets slowed in the last two months, adding $3.2 million in October, a narrow increase of 0.2%, to end month at $1.43 billion
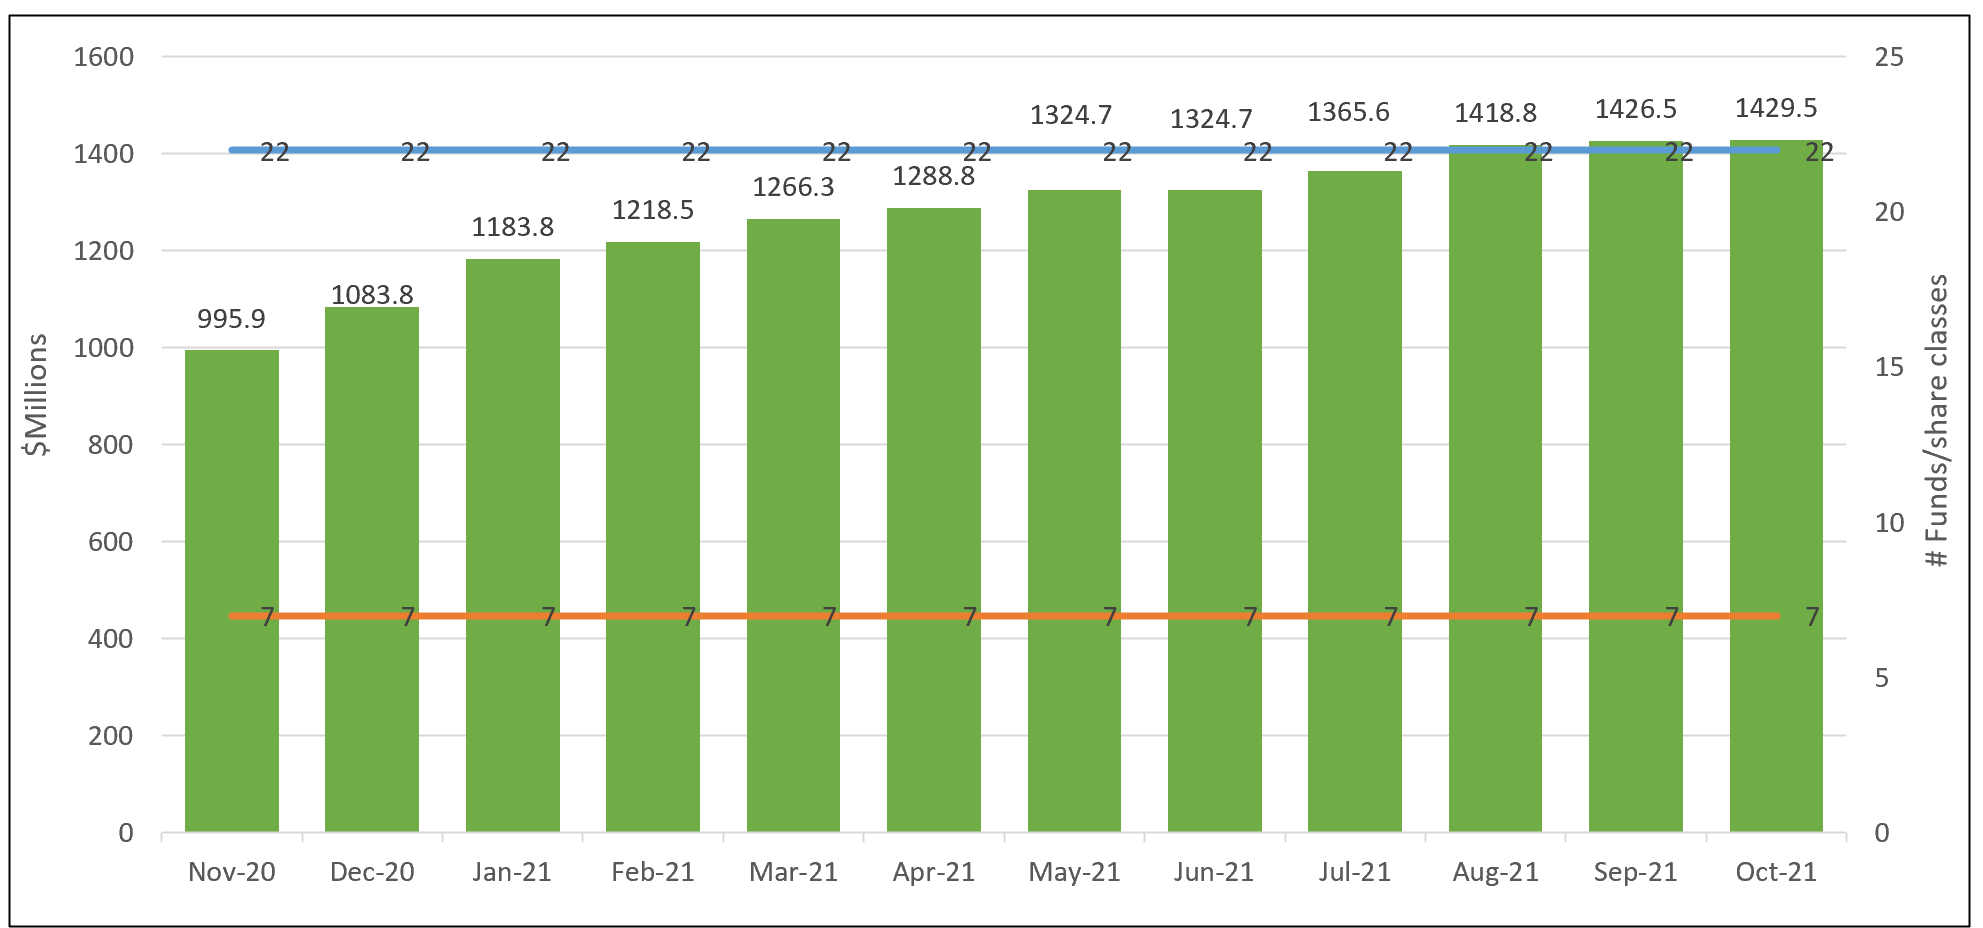
The net assets of the seven green bond funds, consisting of 2 ETFs and five mutual funds with 20 share classes, added just $3.2 million, or a narrow 0.2% increase, to end the month of October at $1.429.5 million. Still, this was a new all-time high for assets under management. Refer to Chart 1. The narrow increase in October compared to last month’s modest $7.5 million, or 1% net gain, and an average monthly net gain of $38.1 million over the first nine months of the year. A contributing factor to the slowing growth may be the three consecutive monthly declines in the average performance of green bond funds relative to equity funds that were up 5.13% according to the S&P 500 during the same time interval.
PIMCO Climate Bond Fund, for the first time, led with the largest monthly net inflow, adding $1.8 million, entirely attributable to the PIMCO Climate Bond Fund Institutional Shares (PCEIX) that netted $1.9 million. The VanEck Green Bond ETF (GRNB) gained $1.7 million but still fell just short of piercing through the $100 million level, ending the month at $99.5 million. TIAA-CREF Green Bond Fund was third with a net gain of $0.9 million, entirely realized by the TIAA-CREF Green Bond Fund-Advisor (TGRKX). Calvert, the largest green bond fund that will soon hit the billion-dollar level, stood at $960.3 million and was flat for the month.
Two recently registered green bond ETFs, both to be managed by Tuttle Capital Management LLC, have again deferred their effective date again, this time pushing off the proposed public offering to November 30th.
Chart 1: Green bond funds and assets under management- November 2020– October 30, 2021
Posting another negative monthly return, some green bond funds nevertheless exceeded the performance of their benchmarks
Green bond funds posted an average decline in October, dropping 45 bps, versus a narrower 3 bps decline for the Bloomberg US Aggregate Bond Index and a -0.50% total return posted by the ICE BofAML Green Bond Index Hedged US Index. Excluding the Franklin Municipal Green Bond Fund that invests in tax-exempt municipal green bonds that carry the “Green Bond” designation in the governing bond documents, the average performance of the green bonds universe dipped by -50 bps. Some funds with varying levels of exposure to foreign currency bonds, including the Calvert Green Bond Fund, iShares Global Green Bond Fund (BGRN) and TIAA-CREF Green Bond Fund outperformed their ICE BofAML Green Bond Index Hedged US Index.
Performance results in October ranged from a high of -0.19% recorded by the TIAA-CREF Green Bond Fund-Advisor Shares to a low of -0.85% registered by the VanEck Green Bond ETF. The average performance of the universe of seven funds also lagged the Bloomberg US Aggregate Bond Index over the trailing three months but has outperformed on a year-to-date basis and trailing 12-months. Refer to Table 1.
Of the seven funds, only three have been in operation long enough to have accumulated a three-year track record. None of these funds have eclipsed the Bloomberg US Aggregate Bond Index while selected share classes offered by two funds beat out the ICE BofAML Green Bond Index Hedged US Index.
The most recent stretch of negative results is detracting from the three-year track record of green bond funds and is reinforcing the view that emphasis on low-cost product offerings.
Leading up to the COP 26 Glasgow Climate Pact green bond issuance declined on a month-over-month basis
Perhaps winded by the high volume of issuance in September, during the month of October leading up to COP 26 in Glasgow, Scotland, green bond issuance declined on a month-over-month basis. A total of $36.6 billion in green bonds came to market, a drop of $36 million, or a decline of 49% relative to $72.3 billion issued in September. Still, October’s volume was the fourth highest in 2021. Refer to Chart 2.
On a year-to-date basis, green bond issuance reached $386.1 billion, continuing to surpass 2020 and reaching within striking range of achieving a new annual high that is expected to exceed $400 million.
October ushered in the first issuance of the European Union’s NextGenerationEU green bond. The new instrument came to market on October 12, 2021 and raised €12 billion (about $US13.9 billion). According to European Sources Online, the 15-year bond was well received and more than 11 times oversubscribed. The proceeds would go on to finance the share of climate-relevant expenditure in the Recovery and Resilience Facility (RRF) aimed at supporting the European Union’s recovery from the COVID 19 pandemic while encouraging the twin green and digital transitions as envisaged by the European Commission. To finance it, the Commission was authorized to issue up to around €800 billion from the capital markets until the end of 2026. In September 2020, the Commission announced its intention to raise 30% of those funds through the issuance of green bonds and use the proceeds to finance green investments and reforms.
The bonds were issued pursuant to the NGEU Green Bond Framework that was drafted in line with the green bond principles of the International Capital Market Association (ICMA). It was also reviewed by a second party opinion provider. The framework is also aligned to a certain extent with the European Green Bond Standard (EUGBS).
The launch of the European Union’s NextGenerationEU green bond is a harbinger of increasing green bond volumes not only in Europe, but the rest of the world on the back of the Glasgow Climate Pact that was concluded on November 13th. The two-week COP 26 climate summit deliberations concluded with 200 countries agreeing to the Glasgow Climate Pact that sets out a consensus on accelerating climate action. Either in the form of negotiations among the participating countries, a series of voluntary side deals or complementary announcements, the summit produced a number of important breakthrough outcomes. These included: pledges to “phase down” coal power, a joint US and China declaration to engage in expanded individual and combined efforts to accelerate the transition to a global net zero economy, the adoption of carbon trading rules, pledges on the part of more than 100 countries to reduce methane emissions, a commitment to return next year to Cop 27 with better climate plans along with new rules that will allow for greater scrutiny on emissions reporting, an agreement to properly set up a mechanism for providing financial help to countries struck by catastrophic climate events, a pact on deforestation, as well as a commitment on the part of banks, investors and insurers representing $130 trillion in assets to decarbonize their businesses by mid-century. In addition, there was a major announcement made by the International Financial Reporting Standards Board (IFRS) to provide the global financial markets with high-quality disclosures on climate and other sustainability issues.
Taken together, an IEA analysis shows that fully achieving all net-zero pledges to date along with pledges made by more than 100-countries to reduce methane could limit global warming to 1.8C; and the Glasgow Climate Pact is expected to stimulate sustainable bond issuances going forward, including green bonds.
Table 1: Green bond funds: Assets, performance through October 30, 2021, and expense ratios
|
Fund Name |
1-Month Return (%) |
3-Month Return (%) |
Y-T-D Return (%) |
12-Month Return (%) |
3-Yesar Return (%) |
AUM ($M) |
Expense Ratio (%) |
|
Calvert Green Bond A* |
-0.46 |
-1.54 |
-1.75 |
-0.16 |
4.95 |
88.9 |
0.73 |
|
Calvert Green Bond I* |
-0.43 |
-1.48 |
-1.54 |
0.09 |
5.21 |
862.1 |
0.48 |
|
Calvert Green Bond R6* |
-0.43 |
-1.46 |
-1.5 |
0.14 |
|
9.3 |
0.43 |
|
Franklin Municipal Green Bond A |
-0.22 |
-1.59 |
-0.15 |
2.61 |
|
1.2 |
0.71 |
|
Franklin Municipal Green Bond Adv |
-0.2 |
-1.53 |
-0.07 |
2.7 |
|
8.8 |
0.46 |
|
Franklin Municipal Green Bond C |
-0.25 |
-1.7 |
-0.29 |
2.47 |
|
0.2 |
1.11 |
|
Franklin Municipal Green Bond R6 |
-0.2 |
-1.52 |
-0.02 |
2.75 |
|
0 |
0.44 |
|
iShares Global Green Bond ETF* |
-0.46 |
-2.09 |
-2.61 |
-1.82 |
|
236.9 |
0.2 |
|
Mirova Global Green Bond A* |
-0.58 |
-1.79 |
-2.82 |
-0.91 |
4.81 |
6.8 |
0.93 |
|
Mirova Global Green Bond N* |
-0.48 |
-1.71 |
-2.51 |
-0.53 |
5.15 |
7.8 |
0.63 |
|
Mirova Global Green Bond Y* |
-0.57 |
-1.72 |
-2.55 |
-0.67 |
5.08 |
29.8 |
0.68 |
|
PIMCO Climate Bond A* |
-0.76 |
-1.21 |
-0.54 |
1.61 |
|
0.8 |
0.94 |
|
PIMCO Climate Bond C* |
-0.84 |
-1.41 |
-1.15 |
0.83 |
|
0 |
1.69 |
|
PIMCO Climate Bond I-2* |
-0.74 |
-1.14 |
-0.27 |
1.91 |
|
1.9 |
0.64 |
|
PIMCO Climate Bond I-3* |
-0.74 |
-1.15 |
-0.32 |
1.85 |
|
0.1 |
0.69 |
|
PIMCO Climate Bond Institutional* |
-0.73 |
-1.11 |
-0.2 |
2.01 |
|
19.3 |
0.54 |
|
TIAA-CREF Green Bond Advisor* |
-0.19 |
-1 |
-0.58 |
1.76 |
|
3.1 |
0.55 |
|
TIAA-CREF Green Bond Institutional* |
-0.19 |
-0.99 |
-0.57 |
1.78 |
|
29.9 |
0.45 |
|
TIAA-CREF Green Bond Premier* |
-0.2 |
-1.03 |
-0.67 |
1.66 |
|
1.1 |
0.6 |
|
TIAA-CREF Green Bond Retail* |
-0.21 |
-1.06 |
-0.89 |
1.5 |
|
7.1 |
0.78 |
|
TIAA-CREF Green Bond Retirement* |
-0.2 |
-1.03 |
-0.67 |
1.66 |
|
14.9 |
0.7 |
|
-0.85 |
-1.88 |
-1.88 |
-0.38 |
4.12 |
99.5 |
0.2 |
|
|
Average/Total |
-0.45 |
-1.42 |
-1.07 |
1.04 |
4.89 |
1,429.5 |
|
|
Bloomberg US Aggregate Bond Index |
-0.03 |
-1.08 |
-1.58 |
-0.48 |
5.63 |
|
|
|
Bloomberg Municipal Total Return Index |
-0.29 |
-1.38 |
0.5 |
2.74 |
5.17 |
|
|
|
ICE BofAML Green Bond Index Hedged US |
-0.48 |
-2.05 |
-2.38 |
-1.35 |
5.14 |
|
|
Notes of Explanation: Blank cells=NA. *Fund invests in foreign currency bonds and performance should be compared to ICE BofAML Green Blond Index Hedged US. Fund total net assets and performance data source: Morningstar Direct; fund filings. Research and analysis by Sustainable Research and Analysis LLC