Summary
- Buoyed by robust economic growth and strong corporate earnings, the S&P 500 Index eked out narrow gain of 0.57% in September even as US stock markets reached all-time new highs.
- Bonds closed the month lower, posting negative results of -0.66% but recording a slight third quarter gain of 0.01%.
- Positive fundamentals shift investor sentiment moving into month-end: US economic growth, strong corporate profits and strong consumer confidence overcame trade, inflation and interest rate concerns.
- The SUSTAIN Equity Fund Index gained 0.52% in September and 7.71% in the third quarter, lagging behind the S&P 500 by 30 bps and 60 bps, respectively.
- In contrast to equity funds, intermediate-term investment grade sustainable bond funds outperformed the Bloomberg Barclays US Aggregate Index in September, albeit by a narrow margin of 5 basis points.
- Sustainable model portfolios lagged their respective indexes in September, posting results that range from a positive 0.21% to -0.37%.
- Sustainable funds closed September at another high point at $321.9 billion, up $11.4 billion of which $10.9 billion, or 96%, is sourced to repurposed funds.
Buoyed by robust economic growth and strong corporate earnings, the S&P 500 Index eked out narrow gain of 0.57% in September even as US stock markets reached all-time new highs
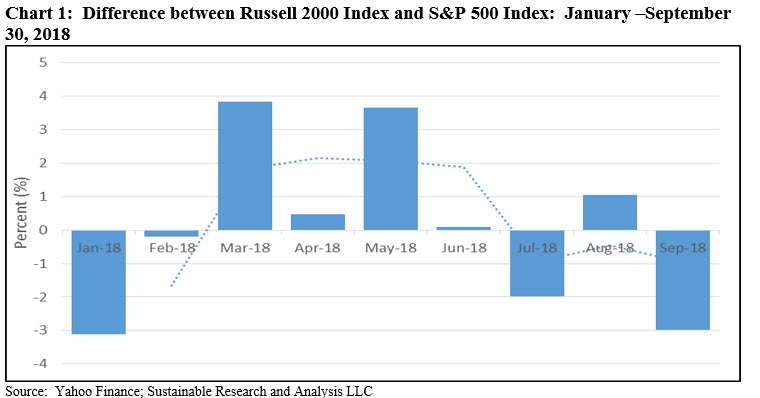
Performance in September across asset classes, geographic regions and styles covered a narrower 16% arc that ranged from a high of 6.85% posted by the price of Brent crude oil to a negative -9.1% recorded by the MSCI India Index. [ihc-hide-content ihc_mb_type=”show” ihc_mb_who=”3,4,5″ ihc_mb_template=”4″ ]Within this range that saw more negative returns than positive and growth stocks outperforming value-oriented stocks, the S&P 500 Index eked out a narrow gain of 0.57% in September even as US stock markets reached all-time new highs. Sustainable funds and ETFs recorded an average drop of -0.37%. Sustainable funds and ETFs[1] recorded an average drop of -0.37%. Beyond the month of September, the S&P 500 recorded the best quarterly increase since 2013, up a strong 7.71%, buoyed by robust economic growth and strong corporate earnings. For the year-to-date and trailing 12-month intervals, the index produced strong gains of 9.94% and 16.11%, respectively. On the other hand, small company stocks, as measured by the Russell 2000, posted their second worst decline this year. The -2.4% September drop narrowed the year-to-date outperformance of small firms relative to large ones and given their declining relative performance differentials may be signaling a loss of momentum for small stocks. Refer to Chart 1.
 Bonds closed the month lower, posting negative results of -0.66% but recording a slight third quarter gain of 0.01%
Bonds closed the month lower, posting negative results of -0.66% against a backdrop of rising yields due to increasing interest rates, continued optimism about the domestic economy and waning fears about the outlook outside the US. As measured by the Bloomberg Barclays US Aggregate Index, investment-grade intermediate bonds finished the quarter with a slight gain of 0.01% while year-to-date and trailing 12-month results ended lower at -1.60% and -1.22%, respectively. Longer-dated 30-year bonds were off 6.53% year-to-date. Concurrently, some indexes around the globe have struggled with a slowdown in economic expansion and a stronger US dollar. The MSCI Emerging Markets Asia posted a decline of -1.69% while MSCI China recorded a loss of -1.4%. At the same time, the MSCI EAFE Index edged out the S&P 500 with a gain of 0.87% in September.
Positive fundamentals shift investor sentiment moving into month-end: US economic growth, strong corporate profits and strong consumer confidence overcame trade, inflation and interest rate concerns
After a weak start to the month when investors returned from the Labor Day weekend to be greeted by news about the bear market in emerging markets, highflying tech names such as Facebook, Inc. (FB), Microsoft Corp. (MSFT) and Alphabet, Inc. (GOOGL) sold off and then rebounded. The selling reversed itself and stocks indexes powered higher despite the Trump Administration’s imposition of 10% tariffs on $200 billion of Chinese products that were countered by China’s retaliation with 5%-10% levies on $60 billion of U.S. goods. It turned out, however, that the tariffs were less severe than expected and trade tensions, while they continue to linger, didn’t escalate as much as feared while the dollar continued to ease. With that, investor sentiment turned and the focus shifted to positive fundamentals, such as US economic growth, strong corporate profits that are expected to expand by a projected 19% from a year earlier, and strong consumer confidence. This was fueled by the Labor Department’s end of month report that the number of Americans filing for unemployment benefits unexpectedly fell and hit the lowest level in nearly 49 years—pointing to robust labor market conditions. The positive outlook was reinforced toward the end of the month when the Federal Reserve Board described economic conditions as “strong.” This was communicated in conjunction with the Fed’s announcement of the widely expected increase to 2% -2.25% of its benchmark interest rate, for the eighth time since 2008, and signaling that it planned to continue to raise interest rates. The Fed also updated the economic projections from members of the Fed’s Board of Governors and regional Fed presidents. The most notable change in this set of projections was a steep upgrade in expectations for economic growth this year. Fed officials’ median forecast now calls for GDP growth to hit 3.1% in 2018, up from 2.8% in June’s projections and substantially higher than the Fed’s forecast for 2.5% GDP growth this year at the end of 2017.
These developments drove the US stock market higher, pushing both the S&P 500 Index and the Dow Jones Industrial Average to reach new all-time highs as of September 20. The Nasdaq Composite pierced through its all-time high the day before. Since then, however, the markets have backed off as investors have begun to reassess the potential for higher interest rates and inflation.
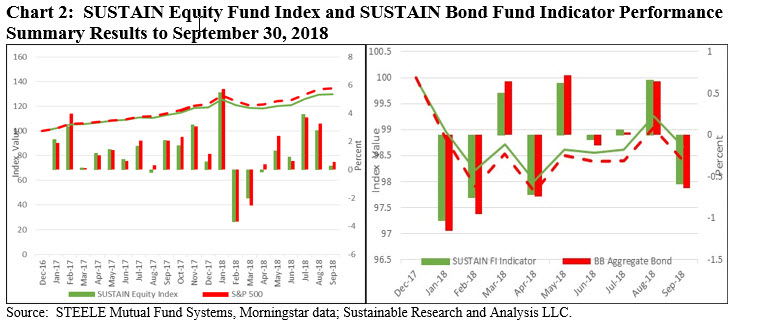
The SUSTAIN Equity Fund Index gained 0.52% in September and 7.71% in the third quarter, lagging behind the S&P 500 by 30 bps and 60 bps, respectively
Against this backdrop, the SUSTAIN Large Cap Equity Fund Index, which tracks the total return performance of the ten largest actively managed large-cap U.S. equity oriented mutual funds that employ a sustainable investing strategy beyond absolute reliance on exclusionary practices, registered a gain of 0.52% in September and 7.71% in the third quarter. This was 30 basis points behind the increase of 0.57% posted by the S&P 500 Index in September and 60 bps behind the S&P 500 in the third quarter.
In contrast to equity funds, intermediate-term investment grade sustainable bond funds outperformed the Bloomberg Barclays US Aggregate Index in September, albeit by a narrow margin of 5 basis points
In contrast to the relative performance of equity funds, intermediate-term investment grade sustainable bond funds outperformed the Bloomberg Barclays US Aggregate Index in September, albeit by a narrow margin of 5 basis points. The SUSTAIN Bond Fund Indicator, which represents the total return performance of a cohort of five sustainable bond funds consisting of similarly managed funds that, like the equity index counterpart, employ sustainable investing strategies beyond absolute reliance on exclusionary practices that track the Bloomberg Barclays U.S Aggregate Index, posted a decline of -0.59% in September versus -0.64% generated by the Bloomberg Barclays U.S. Aggregate Index. Extending the time frame beyond the latest month, the SUSTAIN Bond Fund Indicator also outperforms the Bloomberg Barclays index in the third quarter, year-to-date and 12-month intervals. That said, the results achieved by both over the last twelve months have been negative. Refer to Chart 2.
Sustainable model portfolios lagged their respective indexes in September, posting results that range from a positive 0.21% to -0.37
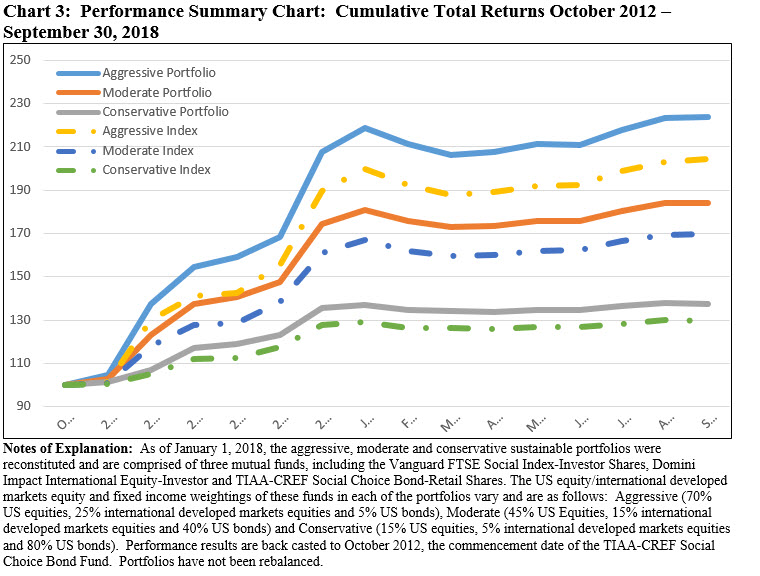
The Aggressive Sustainable Portfolio (95% stocks/5% bonds), Moderate Sustainable Portfolio (60% stocks/40% bonds) and the Conservative Sustainable Portfolio (20%/80%) produced total returns in September that range from a high of 0.21% to a low of -0.37%. These outcomes trailed behind each portfolio’s designated benchmark as the three underlying funds fell behind in September. Refer to Table 1. While the results are more robust, the same is true for the third quarter when the portfolios recorded gains ranging from 2.03% for the Conservative Sustainable Portfolio to 6.07% posted by the Aggressive Sustainable Portfolio. Refer to Table 1.
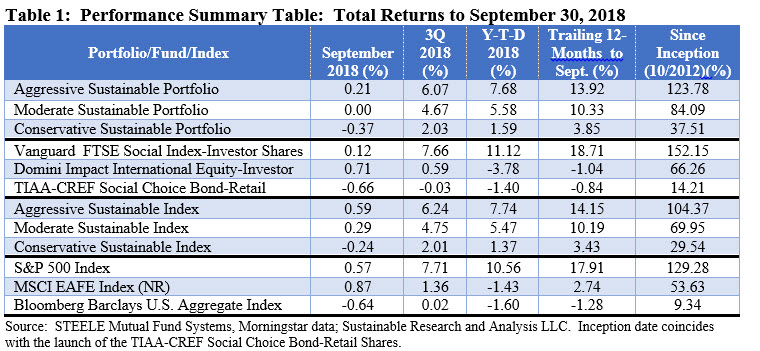
The model portfolios’ relative performance results are mixed when evaluated over the nine-month and 12-month intervals through September as the returns posted by Domini Impact International Equity Investors shares fell behind the MSCI EAFE Index (NR) by 2.34% and 3.78%, respectively. Still, since inception, the three model portfolios are leading their respective benchmarks by wide margins, ranging from 8% for the Conservative Sustainable Portfolio to as much as 19.4% for the Aggressive Sustainable Portfolio. Refer to Chart 3.
Sustainable funds register average gain of 0.37% and performance ranged from 3.13% to -5.85%
Sustainable mutual funds, exchange-traded funds (ETFs) and exchange-traded notes (ETNs) posted an average gain of 0.37%, with 47% of funds recording results ≥0.00%
The top performing funds/share classes in September were the five share classes offered by the very small $1.6 million Aberdeen Japanese Equity Fund whose performance ranged from 3.13% to 3.04% due to upfront as well as deferred sales charges, versus the MSCI Japan (NR) Index that gained 3.04%. Managed by Aberdeen Standard Investments, the fund, according to its prospectus, employs a fundamental, bottom-up equity investment process that also fully integrates environmental, social and governance (ESG) considerations into investment decisions for all equity holdings. Further, this represents an integral component of the manager’s quality rating for all companies.
At the other end of the performance range in September were the $1.1 billion Morgan Stanley Institutional Emerging Markets Leaders Fund and Dreyfus Global Emerging Markets C shares. These funds registered declines that averaged -5.76% versus the MSCI Emerging Markets (NR) loss in September of -0.53%. While their performance in September were in line with each other, the approaches being taken by the two funds with regard to ESG vary. Morgan Stanley Investment Management Company takes into account information about environmental, social and governance issues when making investment decisions, including engaging company management around corporate governance practices as well as what Morgan Stanley deems to be materially important environmental and/or social issues facing a company. The investment process also excludes holdings in tobacco companies. In contrast, the Dreyfus Global Emerging Markets Fund emphasizes governance considerations as well as a focus on investment themes based primarily on observable global economic, industrial, or social trends. Refer to Table 2.

Sustainable funds close September at another high point at $321.9 billion, up $11.4 billion of which $10.9 billion, or 96%, is sourced to repurposed funds
The net assets of 1,096 sustainable funds[1], including mutual fund share classes, exchange-traded funds (ETFs) and exchange-traded notes (ETNs), ended the month of September with $321.9 billion in assets under management versus $310.5 billion at the end of August. The increase in net assets for the month, in the amount of $11.4 billion, was sourced to repurposed funds that added a total of $10.9 billion attributable to three fund firms, including two new fund group additions to the sustainable funds sphere, and a total of eight funds and 31 share classes in total. In addition, the segment benefited from an estimated positive net cash flow in the amount of $1.65 billion, including the launch of three new ETFs in September, while market movement contributed to a decline in assets to the tune of about -$1.2 billion. Refer to Chart 4.
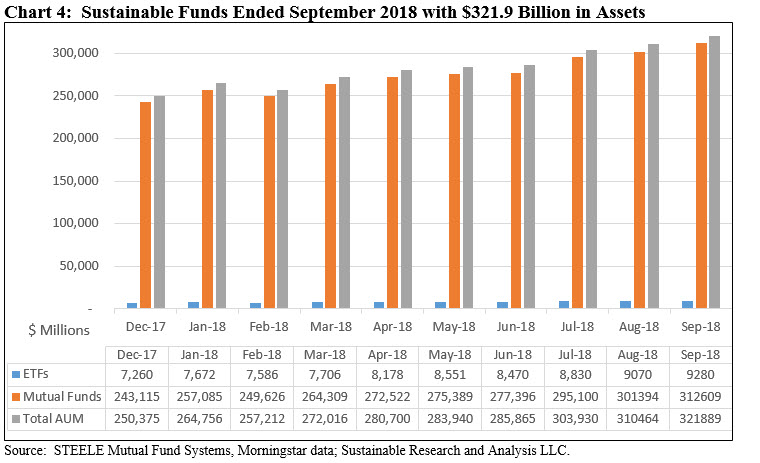
Mutual fund assets stood at $312.6 billion as of the end of September while ETFs and ETNs closed the month at $9.3 billion, for increases of $11.2 billion (3.7%) and $220.7 million (2.3%), respectively, relative to last month. The relative proportion of the two segments remain unchanged at about 97% and 3%, respectively. Assets sourced to institutional only mutual funds/share classes, 408 in total, versus all other funds gained $7.6 billion, or 7.4%, to $110.3 billion. This investor group account’s for 34.2% of the segment’s assets, versus $102.7 billion at the end of August.
At the end of September, the universe of explicitly designated mutual funds and ETFs/ETNs were sourced to 120 firms[2], including the addition the Jensen and Calamos fund groups with their repurposed funds while three new ETFs were launched, including the Vanguard ESG International Stocks ETF and Vanguard ESG US Stock ETF as well as the Impact Shares Sustainable Development Goals Global Equity ETF.
[1] 1,091 funds reported performance results for the full month of September 2018. Further, 5 share classes offered by the Franklin Select US Equity Fund with $99.8 million in assets are excluded from the September analysis as their most recent prospectus does not reflect the adoption of a sustainable strategy or approach.
[2] BlackRock and iShares are treated as two separate fund groups.
[/ihc-hide-content]


