Summary
U.S. Stocks as well as investment-grade bonds delivered positive results in May; small capitalization stocks in general and growth stocks in particular led the pack
- The SUSTAIN Equity Fund Index gained 1.35% but lagged behind the S&P 500 Index by almost 1.1%; sustainable bond funds gained 0.62% and posted the best monthly performance results in May but continue to lag the Bloomberg Barclays U.S. Aggregate Bond Index.
- Three sustainable model portfolios posted positive results in May, ranging from 1.04% to 1.85%. These benefited from returns achieved by two of the three underlying mutual funds that comprise the model portfolios.
- Sustainable funds ended the month of May at $283.9 Billion, adding $3.3 billion in assets and one new fund.
U.S. Stocks as well as Investment-Grade Bonds Delivered Positive Results in May; Small Capitalization Stocks in General and Growth Socks in Particular Led the Pack
U.S. stocks as well as investment-grade bonds both delivered positive results in May, with small capitalization stocks in general and growth stocks in particular leading the pack. The Russell 2000 Growth Index recorded a gain of 6.3% whereas the S&P 500 Index posted a total return increase of 2.16%, second only to the 5.73% monthly return recorded in January. This increase was still not sufficient in magnitude to erase the decline since the peak reached on January 26th of this year. Since that date and through the end of May, the S&P 500 Index is down -5.0% while on a year-to-date basis the benchmark remains in positive territory with a gain of 1.18%. At the same time, U.S. investment-grade bonds, based on the performance of the Bloomberg Barclays U.S. Aggregate Bond Index, almost wiped away April’s -0.74% loss with a 0.71% increase in May. Even as the Federal Reserve held interest rates steady at the conclusion of its two-day policy meeting at the beginning of the month, interest rates fluctuated widely, with the 10-year Treasury yield moving up to 3.11% on May 16th but closing lower on May 30th at 2.85% versus 2.95% at the end of April. European, Asian and Latin American stocks, dominated by emerging market countries Brazil and Mexico, posted negative returns, ranging from -2.25% to -14.2%.
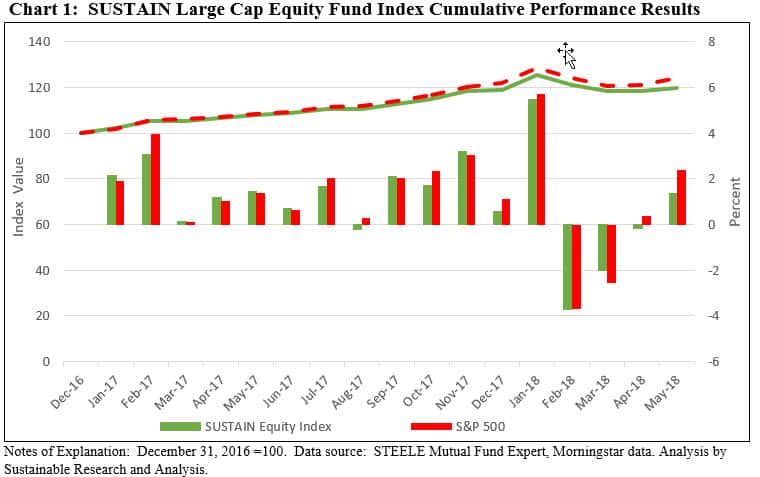
Also in May, sustainable equity funds, as measured by the SUSTAIN Equity Fund Index, gained 1.35% but lagged behind the S&P 500 Index by almost 1.1% while on a year-to-date basis, the SUSTAIN index posted a slight gain of 0.70% versus an increase of 2.02% recorded by the S&P 500 Index. Sustainable bond funds added 0.62% and posted the best monthly performance results in May since the start of the year but continue to lag the Bloomberg Barclays U.S. Aggregate Bond Index. Refer to Chart 1.

Rising sales and robust first-quarter growth in corporate accounting profits linked to a strong global economy, a weakening dollar at least through February 15, 2018 when it reached its nadir and began to strengthen, and a cut in the corporate tax rate to 21% from 35% overcame geopolitical concerns, including a short lived flare up in Italy due to political divisions that threaten the Eurozone, domestic political uncertainties and trade war fears that buffeted stocks as well as bonds throughout the month. Still, there were as many negative as positive days for stocks. The Information Technology sector was the best performer in May, posting a gain of 7.13% as companies like Apple Inc. and Facebook announced plans for stock buybacks. The Industrials sector followed with a gain of 2.69% while the Energy sector added 2.53% on the strength of crude oil prices. At the other end of the range, Telecommunications Services, Consumer Staples and Utilities brought up the rear with declines of -2.27%, -1.79% and -1.69%, respectively. A strengthening dollar starting on February 16 and rising U.S. bond yields, at least through the middle of May, upended currencies and bonds in the developing world which renewed concerns about the ability of developing nations to withstand central banks pulling back from monetary stimulus.
Two developments in particular are expected to continue to unfold and effect the markets in the months to come, namely trade and corporate earnings. Regarding trade, following months of U.S. threats to impose tariffs on the last day in May, the U.S. withdrew the temporary 25% Steel and 10% aluminum tariff exemptions that had been announced in March covering imports from Europe, Canada and Mexico that were intended to extort trade concessions from U.S. allies. These were withdrawn, according to Commerce Secretary Wilbur Ross, as the U.S. “was unable to reach satisfactory arrangements.” In addition to risking retaliatory levies which were swiftly announced, taxing steel and aluminum products are expected to make U.S. manufacturers less competitive.
As for corporate earnings, profits for companies in the S&P 500 grew by a significant 26.3% in the first quarter relative to a year earlier, according to Thomson Reuters I/B/E/S, and for the reasons cited above. Yet according to the Commerce Department’s measure of corporate profits which were released at the end of the month along with GDP data, corporate profits rose by just 0.1% in the first quarter. This figure capture public as well as private companies, and reflects various adjustments, including adjustments for the tax benefits linked to the year-end 2017 tax cut without which it is estimated that corporate profits would have been down by 6%, exclusion of profits from overseas operations and adjustments for one-charges. Further, the government’s figures are not based on earnings per share and so these don’t benefit from the $178 billion in first quarter buy-backs. While this is based on data that tends to be volatile and covers only one quarter, the data may point to weaker profits going forward. This may also offer further explanation for the market’s lackluster performance over the last four months.
Sustainable Portfolios Post Positive Results in May, ranging from 1.04% to 1.85%, Benefiting from Returns Achieved by Two of Three Underlying Sustainable Mutual Funds
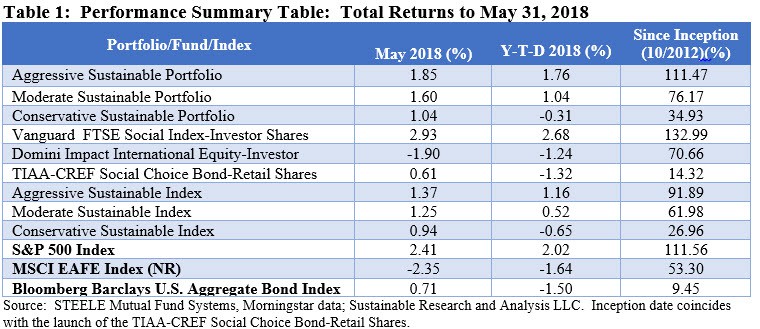
The Aggressive Sustainable Portfolio (95% stocks/5% bonds), Moderate Sustainable Portfolio (60% stocks/40% bonds) and the Conservative Sustainable Portfolio (20%/80%) exceeded the performance of their corresponding non-ESG indexes in May. Results were lifted to varying degrees by the 2.93% total return recorded by Vanguard FTSE Social Index Fund-Investor Shares, 52 basis points above the S&P 500 Index. TIAA-CREF Social Choice Bond Fund-Retail Shares, up 0.61%, also contributed positively even as the fund slightly lagged its underlying benchmark. The Domini Impact International Equity Fund-Investor Shares, down -1.9%, detracted from May’s portfolio results even as the fund outperformed its non-ESG benchmark. Refer to Table 1.

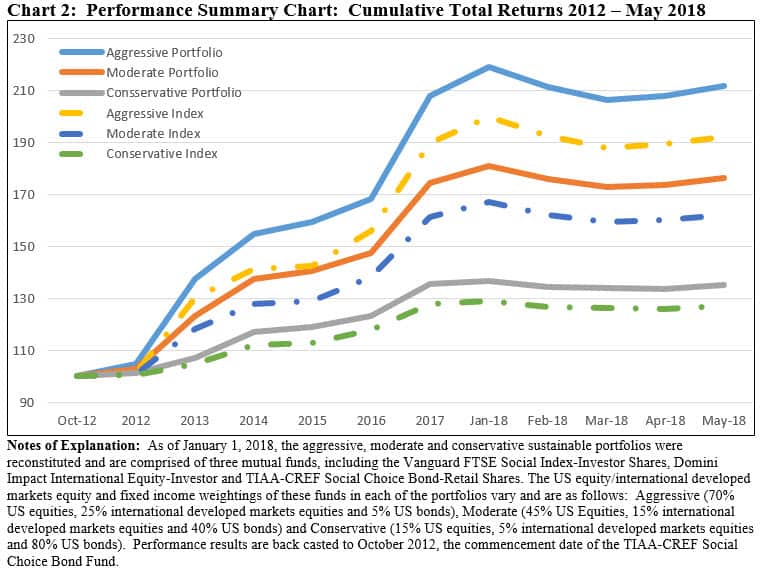
Not only did each of the portfolios generate positive returns, but these results were also the second best so far this year. On a year-to-date basis and since inception, each of the sustainable portfolios continues to exceed their non-ESG indexes by margins ranging from a low of 0.34% year-to-date to a high of 19.58% achieved by the Aggressive Sustainable Portfolio since its inception as of October 2012. Refer to Chart 2.

Sustainable Funds Register Average Gain of 0.781% in May, Ranging from a Low of -11.24% to a High of 10.42%
Within a universe of 956 sustainable funds, including mutual funds, exchange-traded funds (ETFs) and exchange-traded notes (ETNs) and their corresponding share classes, returns for the month of May averaged 0.78%. A large number of funds, 677 funds, or 71%, posted 0.00 to positive results for the month.
The highest return was again achieved by the iPath Global Carbon ETN, a $10.0 million exchange-traded note that provides exposure to the global price of carbon by referencing the price of carbon emissions credits from the world’s major emissions related mechanisms. This highly volatile ETN was up 10.42% and 92.36% on a year-to-date basis.
At the other end of the range is the Morgan Stanley Institutional Frontier Markets Fund-C Shares, which posted a return of -11.24% and reflected May’s weakness in emerging markets. This $616.2 million fund invests in equity securities of companies operating in frontier emerging markets and as of April 30, 2018 began to take into account information about environmental, social and governance issues when making investment decisions and to engage with company management around corporate governance practices as well as materially important environmental and/or social issues facing a company. The fund also excludes holdings in tobacco companies. Refer to Table 2.

Sustainable Funds Close May at $283.9 Billion, Adding $3.3 Billion and One New Fund
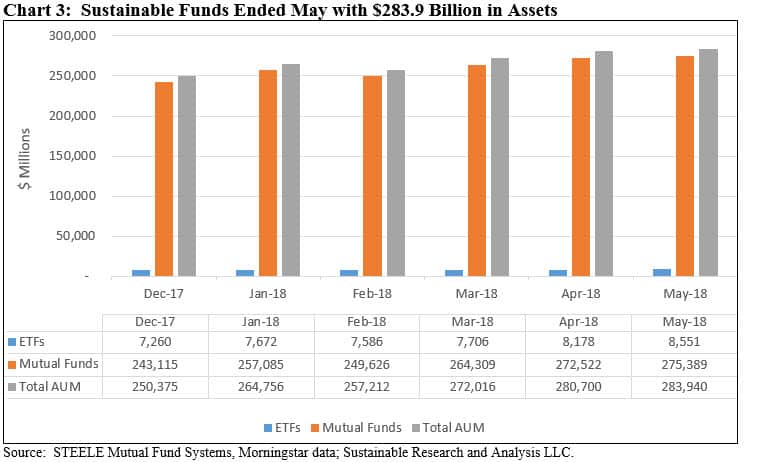
The net assets of 965 sustainable funds, including mutual funds, ETFs and ETNs, ended the month of May at $283.9 billion versus $280.7 billion at the end of April, representing an increase of $3.3 billion or 1.2%.
An estimated $2.3 billion is attributable to the increase in stock and bond prices. At the same time, the universe of sustainable funds experienced approximately $900 million in net inflows or 0.32% of the total monthly uptick for the segment. This increase also reflected the addition of a new fund into the segment, the Goldman Sachs ESG Emerging Markets Equity Fund offering six share classes. Refer to Chart 3.

The number of fund groups offering explicitly identified sustainable mutual funds and ETFs, including ETNs, remained unchanged at 113 fund groups. Of these, the top 10 account for $215.0 billion in assets under management or about 76% of the assets in the segment. Mutual funds ended the month at $275.4 billion, comprised of 893 funds and share classes, accounting for 97% of sustainable fund assets. ETFs and ETNs closed the month with $8.6 billion in assets across 72 ETFs, including one ETN.
Monthly Sustainable Portfolios Performance Summary: May 2018
Summary
Share This Article:
Summary
U.S. Stocks as well as investment-grade bonds delivered positive results in May; small capitalization stocks in general and growth stocks in particular led the pack
U.S. Stocks as well as Investment-Grade Bonds Delivered Positive Results in May; Small Capitalization Stocks in General and Growth Socks in Particular Led the Pack
U.S. stocks as well as investment-grade bonds both delivered positive results in May, with small capitalization stocks in general and growth stocks in particular leading the pack. The Russell 2000 Growth Index recorded a gain of 6.3% whereas the S&P 500 Index posted a total return increase of 2.16%, second only to the 5.73% monthly return recorded in January. This increase was still not sufficient in magnitude to erase the decline since the peak reached on January 26th of this year. Since that date and through the end of May, the S&P 500 Index is down -5.0% while on a year-to-date basis the benchmark remains in positive territory with a gain of 1.18%. At the same time, U.S. investment-grade bonds, based on the performance of the Bloomberg Barclays U.S. Aggregate Bond Index, almost wiped away April’s -0.74% loss with a 0.71% increase in May. Even as the Federal Reserve held interest rates steady at the conclusion of its two-day policy meeting at the beginning of the month, interest rates fluctuated widely, with the 10-year Treasury yield moving up to 3.11% on May 16th but closing lower on May 30th at 2.85% versus 2.95% at the end of April. European, Asian and Latin American stocks, dominated by emerging market countries Brazil and Mexico, posted negative returns, ranging from -2.25% to -14.2%.
Also in May, sustainable equity funds, as measured by the SUSTAIN Equity Fund Index, gained 1.35% but lagged behind the S&P 500 Index by almost 1.1% while on a year-to-date basis, the SUSTAIN index posted a slight gain of 0.70% versus an increase of 2.02% recorded by the S&P 500 Index. Sustainable bond funds added 0.62% and posted the best monthly performance results in May since the start of the year but continue to lag the Bloomberg Barclays U.S. Aggregate Bond Index. Refer to Chart 1.
Rising sales and robust first-quarter growth in corporate accounting profits linked to a strong global economy, a weakening dollar at least through February 15, 2018 when it reached its nadir and began to strengthen, and a cut in the corporate tax rate to 21% from 35% overcame geopolitical concerns, including a short lived flare up in Italy due to political divisions that threaten the Eurozone, domestic political uncertainties and trade war fears that buffeted stocks as well as bonds throughout the month. Still, there were as many negative as positive days for stocks. The Information Technology sector was the best performer in May, posting a gain of 7.13% as companies like Apple Inc. and Facebook announced plans for stock buybacks. The Industrials sector followed with a gain of 2.69% while the Energy sector added 2.53% on the strength of crude oil prices. At the other end of the range, Telecommunications Services, Consumer Staples and Utilities brought up the rear with declines of -2.27%, -1.79% and -1.69%, respectively. A strengthening dollar starting on February 16 and rising U.S. bond yields, at least through the middle of May, upended currencies and bonds in the developing world which renewed concerns about the ability of developing nations to withstand central banks pulling back from monetary stimulus.
Two developments in particular are expected to continue to unfold and effect the markets in the months to come, namely trade and corporate earnings. Regarding trade, following months of U.S. threats to impose tariffs on the last day in May, the U.S. withdrew the temporary 25% Steel and 10% aluminum tariff exemptions that had been announced in March covering imports from Europe, Canada and Mexico that were intended to extort trade concessions from U.S. allies. These were withdrawn, according to Commerce Secretary Wilbur Ross, as the U.S. “was unable to reach satisfactory arrangements.” In addition to risking retaliatory levies which were swiftly announced, taxing steel and aluminum products are expected to make U.S. manufacturers less competitive.
As for corporate earnings, profits for companies in the S&P 500 grew by a significant 26.3% in the first quarter relative to a year earlier, according to Thomson Reuters I/B/E/S, and for the reasons cited above. Yet according to the Commerce Department’s measure of corporate profits which were released at the end of the month along with GDP data, corporate profits rose by just 0.1% in the first quarter. This figure capture public as well as private companies, and reflects various adjustments, including adjustments for the tax benefits linked to the year-end 2017 tax cut without which it is estimated that corporate profits would have been down by 6%, exclusion of profits from overseas operations and adjustments for one-charges. Further, the government’s figures are not based on earnings per share and so these don’t benefit from the $178 billion in first quarter buy-backs. While this is based on data that tends to be volatile and covers only one quarter, the data may point to weaker profits going forward. This may also offer further explanation for the market’s lackluster performance over the last four months.
Sustainable Portfolios Post Positive Results in May, ranging from 1.04% to 1.85%, Benefiting from Returns Achieved by Two of Three Underlying Sustainable Mutual Funds
The Aggressive Sustainable Portfolio (95% stocks/5% bonds), Moderate Sustainable Portfolio (60% stocks/40% bonds) and the Conservative Sustainable Portfolio (20%/80%) exceeded the performance of their corresponding non-ESG indexes in May. Results were lifted to varying degrees by the 2.93% total return recorded by Vanguard FTSE Social Index Fund-Investor Shares, 52 basis points above the S&P 500 Index. TIAA-CREF Social Choice Bond Fund-Retail Shares, up 0.61%, also contributed positively even as the fund slightly lagged its underlying benchmark. The Domini Impact International Equity Fund-Investor Shares, down -1.9%, detracted from May’s portfolio results even as the fund outperformed its non-ESG benchmark. Refer to Table 1.
Not only did each of the portfolios generate positive returns, but these results were also the second best so far this year. On a year-to-date basis and since inception, each of the sustainable portfolios continues to exceed their non-ESG indexes by margins ranging from a low of 0.34% year-to-date to a high of 19.58% achieved by the Aggressive Sustainable Portfolio since its inception as of October 2012. Refer to Chart 2.
Sustainable Funds Register Average Gain of 0.781% in May, Ranging from a Low of -11.24% to a High of 10.42%
Within a universe of 956 sustainable funds, including mutual funds, exchange-traded funds (ETFs) and exchange-traded notes (ETNs) and their corresponding share classes, returns for the month of May averaged 0.78%. A large number of funds, 677 funds, or 71%, posted 0.00 to positive results for the month.
The highest return was again achieved by the iPath Global Carbon ETN, a $10.0 million exchange-traded note that provides exposure to the global price of carbon by referencing the price of carbon emissions credits from the world’s major emissions related mechanisms. This highly volatile ETN was up 10.42% and 92.36% on a year-to-date basis.
At the other end of the range is the Morgan Stanley Institutional Frontier Markets Fund-C Shares, which posted a return of -11.24% and reflected May’s weakness in emerging markets. This $616.2 million fund invests in equity securities of companies operating in frontier emerging markets and as of April 30, 2018 began to take into account information about environmental, social and governance issues when making investment decisions and to engage with company management around corporate governance practices as well as materially important environmental and/or social issues facing a company. The fund also excludes holdings in tobacco companies. Refer to Table 2.
Sustainable Funds Close May at $283.9 Billion, Adding $3.3 Billion and One New Fund
The net assets of 965 sustainable funds, including mutual funds, ETFs and ETNs, ended the month of May at $283.9 billion versus $280.7 billion at the end of April, representing an increase of $3.3 billion or 1.2%.
An estimated $2.3 billion is attributable to the increase in stock and bond prices. At the same time, the universe of sustainable funds experienced approximately $900 million in net inflows or 0.32% of the total monthly uptick for the segment. This increase also reflected the addition of a new fund into the segment, the Goldman Sachs ESG Emerging Markets Equity Fund offering six share classes. Refer to Chart 3.
The number of fund groups offering explicitly identified sustainable mutual funds and ETFs, including ETNs, remained unchanged at 113 fund groups. Of these, the top 10 account for $215.0 billion in assets under management or about 76% of the assets in the segment. Mutual funds ended the month at $275.4 billion, comprised of 893 funds and share classes, accounting for 97% of sustainable fund assets. ETFs and ETNs closed the month with $8.6 billion in assets across 72 ETFs, including one ETN.
Sustainableinvest.com
Benefits
Free access to regularly updated original research and analysis focused exclusively on sustainable finance and investing, providing investors with the guidance needed to make informed investment decisions that align with their personal values and financial goals while also contributing to the advancement of positive long-term environmental and social outcomes.
By offering financial support for our current work, either in the form of a one-time or regular contributions, you help to defray some of the costs associated with conducting our research and analysis as well as to maintain the www.sustainablest.wpengine.com website.
Helping us to expand our research capabilities and offerings over time to cover additional relevant topics geared to sustainable investors.
Sign up to free newsletters.
By submitting this form, you are consenting to receive marketing emails from: . You can revoke your consent to receive emails at any time by using the SafeUnsubscribe® link, found at the bottom of every email. Emails are serviced by Constant Contact