Summary
• June stock and bond market performance alternated as shifting sentiments guided by strong economic growth prospects and positive geopolitical news gave way to interest rate worries and increasing concerns over a looming trade war.
• The S&P 500 Index posted a gain of 0.62% while the Bloomberg Barclays U.S. Aggregate Bond Index recorded a decline of -0.12%. The SUSTAIN Equity Fund Index posted an increase of 0.90% in June while the SUSTAIN Bond Fund Indicator closed the month lower at -0.06%.
• The Aggressive, Moderate and Conservative sustainable model portfolios posted slight negative results in June but delivered positive total returns for the quarter.
• The sustainable funds universe consisting of 1,004 mutual funds, including share classes, exchange-traded funds (ETFs) and exchange-traded notes (ETNs) registered an average loss of -0.54% in June, ranging from high of 4.48% to a low of -10.78%.
• Sustainable funds ended the first half of 2018 at $285.9 billion in net assets, adding $1.9 billion in June bolstered by repurposed funds but experiencing $375.2 million in net outflows
June Market Performance Influenced by Strong Economic Growth Prospects and Positive Geopolitical News that Gave Way to Trade Concerns and Higher Interest Rates
Returns for the month of June reflected a best-to-worst performance range for major market segments from about 4.45% posted by the U.S. REIT sector per the Wilshire U.S. REIT Index, to about -5.46% for Asia-based stocks generally and China stocks in particular, per the FTSE China Total Return Index, as the yuan declined against the dollar due to a combination of selling on the part of investors and the Chinese central bank’s efforts to guide the currency lower as the trade conflict with the U.S. escalated. The broad measure of the U.S. stock market, captured by the S&P 500 Index, was up 0.62% while intermediate investment-grade bonds reversed course and recorded a decline of -0.12%.[ihc-hide-content ihc_mb_type=”show” ihc_mb_who=”3,4,5″ ihc_mb_template=”4″ ] The segment is also down for the quarter, year-to-date and trailing twelve months as contrasted to large cap equities that are in positive territory over these intervals. The SUSTAIN Equity Fund Index posted an increase of 0.90% in June while the SUSTAIN Bond Fund Indicator closed the month lower at -0.06% (Refer to SUSTAIN Large Cap Equity Fund Index Up 0.90% in June, Leading S&P 500 Index by 28 BPS). Strong economic growth prospects in the second quarter and positive geopolitical news that a summit with North Korean leader Kim Jong Un and President Trump will take place gave way to concerns regarding higher interest rates and trade war tensions between the U.S., the European Union, Canada, Mexico and China.
The broad stock market began the month on a positive note, registering its best daily gain of 1.08% on news that the on-again off-again summit with North Korean leader Kim Jong Un will proceed to take place in Singapore on June 12th as initially planned. For now, this development seemed to defuse concerns about the threats of a nuclear showdown and tilted the market’s focus on the broader economic growth in the second quarter, including positive news on the jobs front that saw the unemployment rate in May drop down to the lowest level since April 2000 to an adjusted 3.8%, as well as strong corporate earnings. The market recorded further advances through June 12th, the day of the summit, reaching a peak for the month of 3.01%, but trending lower thereafter. Stocks fell in response to the Federal Reserve’s decision, for the second time this year, to raise the federal-funds rate by a quarter-percentage point to a range between 1.75% and 2%. The Federal Reserve Board also telegraphed its intention to raise rates four times this year, up from a projection of three at the March 2018 meeting. 10-year Treasuries reached 2.98%, the highest level for the month, following the Federal Reserve Open Market Committee’s announcement on June 13, but ended the month lower at 2.85%, down 2 basis points versus the start of the month. At the same time, the spread between 10-Year and 2-Year Treasuries, a precursor to a recession, narrowed to 33 bps from 43 bps at the end of May.
In the end, interest rate considerations were eclipsed by tensions over the Trump administration’s trade policies, including a decision earlier in the month to impose tariffs on steel and aluminum imports from the European Union (EU), Canada and Mexico. The EU in turn retaliated by placing tariffs on many U.S. products such as Harley-Davidson motorcycles and bourbon. President Trump’s action was escalated when it was announced on June 16th that fresh tariffs would be placed on $50 billion in Chinese goods and this, in turn, prompted swift retribution from Beijing. Stocks in the U.S, shifted lower after peaking for the month on June 12th. Further, trade tensions reverberated in Europe and China as investors grew more concerned about the impact this could have on the world’s second largest economy where growth might already be starting to weaken. At the same time, the trade conflict could dent European corporate profits and dent a still fragile European economy. This was reflected in the performance of stocks in Europe and China which posted June declines of -1.22% and -5.46%, respectively. Emerging market stocks were the hardest hit in June, recording a decline of -4.2% according to the MSCI Emerging Markets Index as emerging market countries were coming under growing economic stress in part due to a strong dollar.
Oil prices reached their highest level in more than 3-years toward the end of the month, with Brent crude reaching $77.62 on June 27, as threats to global supply gathered momentum on the heels of harsh rhetoric from the U.S. government on Iran sanctions and a surprising drop in U.S. crude inventories reported by the U.S. Energy Information Administration. This even in the light of the Organization of the Petroleum Exporting Countries decision a week earlier to increase production. In turn, energy shares, which have historically been closely tied to the price of oil, posted their best quarterly gain since 2011.
Small stocks, which generate most of their revenue domestically, benefited this year from the trade tensions, a rising dollar and concerns about weaker global growth. Conversely, the dollar’s rally and expectations of strong U.S. growth are upending investments across the globe, affecting commodity prices and emerging markets.
Model Portfolios Post Slight Negative Results in June but Deliver Positive Total Returns in the Second Quarter
The Aggressive Sustainable Portfolio (95% stocks/5% bonds), Moderate Sustainable Portfolio (60% stocks/40% bonds) and the Conservative Sustainable Portfolio (20%/80%) posted negative returns in the month of June, driven by the negative results recorded by both Domini Impact International Equity Fund-Investor Shares (-2.49%) and TIAA-CREF Social Choice Bond-Retail Shares (-0.06%). The three model portfolios also lagged their non-sustainable benchmarks.
The reverse, however, is true in terms of second quarter performance results. During the latest three month interval, the three model portfolios posted positive results and exceeded the performance of the same underlying indexes. Refer to Table 1.
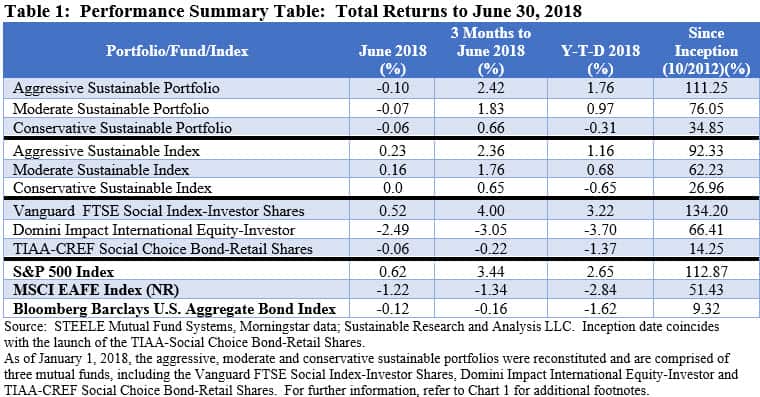
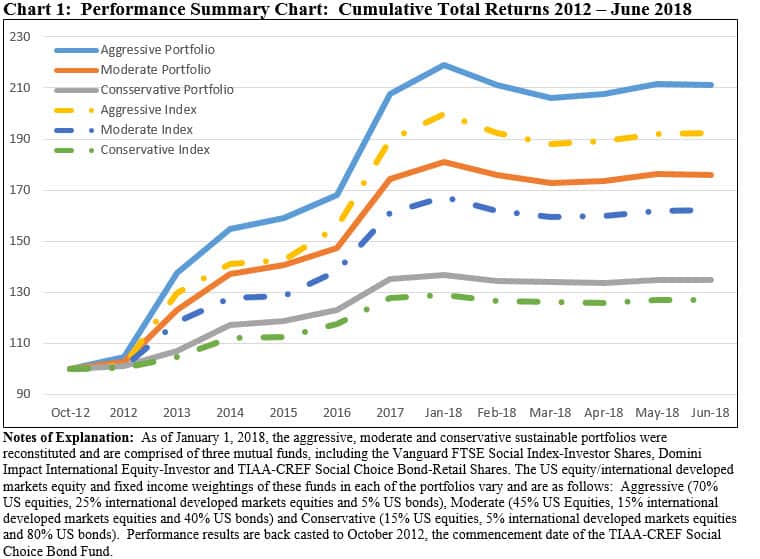
Since inception, the three model portfolios, which were reconstituted as of January 1, 2018 to add foreign equity exposure (refer to Chart 1 footnote), continue to generate strong total return results both in absolute terms as well as relative to their non-sustainable indexes. The underperformance results in June slightly narrowed the differentials in the cumulative returns since inception between the model portfolios and their comparison indexes. These differentials now range from a cumulative low of 7.9% applicable to the Conservative Sustainable Portfolio, to 13.8% for the Moderate Sustainable Portfolio and 18.9% applicable to the Aggressive Sustainable Portfolio. Refer to Chart 1.
Sustainable Funds Register Average Loss of –0.54% in June, Ranging from a High of 4.48% to a Low of -10.78%
For a universe of 1,004 sustainable funds, including mutual funds, exchange-traded funds (ETFs) and exchange-traded notes (ETNs) and their corresponding share classes, returns for the month of June averaged -0.54%. These include all funds registering performance results for the full month. A total of 420 funds, or 41.8%, posted 0.00 to positive results for the month.
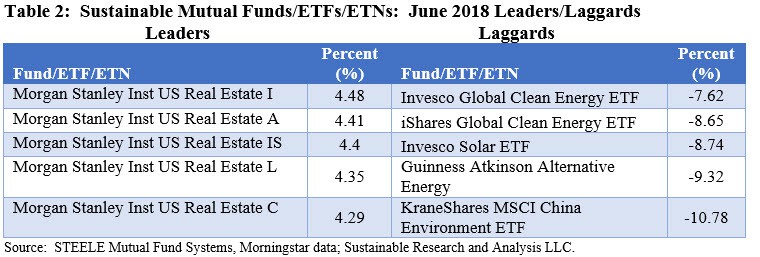
In line with the month of June’s best capital market segment results, the highest return of 4.48% was posted by the Morgan Stanley Inst US Real Estate Fund I, a fund that recently amended its prospectus to reflect that the fund’s adviser may consider information about environmental, social and governance (ESG) issues in its bottom-up stock selection process when making investment decisions. Further, the fund’s adviser, Morgan Stanley Investment Management Inc., may engage with company management regarding corporate governance practices as well as what the adviser deems to be materially important environmental and/or social issues facing a company.
Negatively impacted by the decline in the yuan against the dollar for the reasons noted previously, the worst performing fund was the KraneShares MSCI China Environment ETF, down -10.78%. The ETF seeks to track the performance of the MSCI China IMI Environment 10/40 Index, comprised of securities that derive at least 50% of their revenues from environmentally beneficial products and services. The index is based on five key Clean Technology environmental themes: Alternative Energy, Sustainable Water, Green Building, Pollution Prevention and Energy Efficiency. The index aims to serve as a benchmark for investors seeking exposure to Chinese companies that focus on contributing to a more environmentally sustainable economy by making efficient use of scarce natural resources or by mitigating the impact of environmental degradation. Constituent selection is based on ESG data provided by MSCI. Refer to Table 2.
Sustainable Funds End the First Half of the Year at $285.9 Billion, Adding $1.9 Billion but Experiencing $375.2 Million in Net Outflows
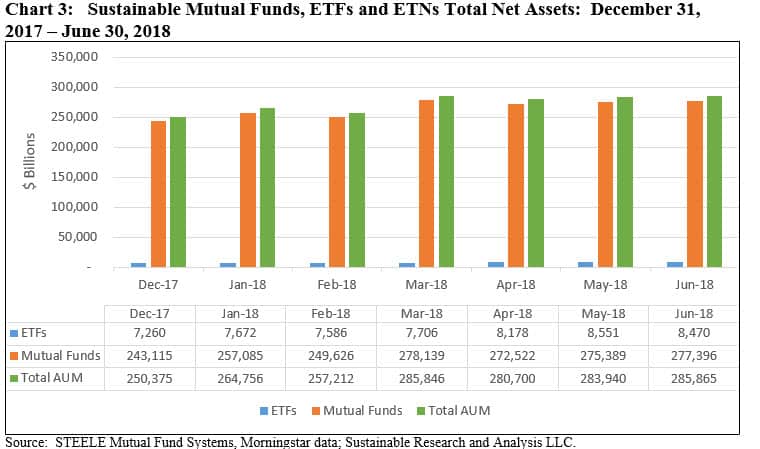
The net assets of 1,025 sustainable funds, including mutual funds, ETFs and ETNs, ended the month of June with $285.9 billion in assets versus $283.9 billion at the end of May-for an increase of $1.9 billion or 0.68%. Since the start of the year, sustainable funds have added $35.5 billion, but much of that sum, $30.9 billion, or 87%, is attributable to repurposed funds, that is existing funds that have formally adopted a sustainable strategy or approach by amending their prospectus.
ETFs and ETNs closed the month at $8.5 billion while mutual funds stood at $277.4 billion as of June 30, 2018.
A total number of 1,025 funds offered by 115 fund groups, including share classes, ETFs and ETNs were in operation at the end of June, reflecting an increase of 60 funds that included repurposed funds and new fund and/or share class launches. New funds that were funded as of the end of June include the $7.9 million Amplify Advanced Battery Metals and Materials ETF and $25.2 million Fidelity Sustainability Bond Index Fund. Refer to Chart 3.
[/ihc-hide-content]


