Model portfolios: Two of three sustainable model portfolios were eclipsed by their conventional benchmarks
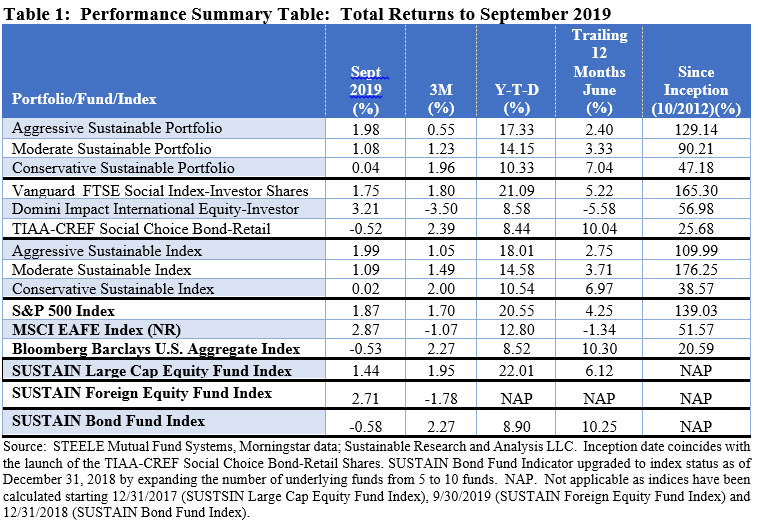
In a month when the performance of equities and bonds reversed positions as large cap equities, tracked by the S&P 500 Index, posted a total return gain of 1.87% while investment-grade intermediate bonds ended the month lower at -0.53% on the back of higher yields, the three sustainable model portfolios with the greatest exposure to equities, both domestic and international, produced results that lagged behind their conventional indices. The Conservative Sustainable Portfolio (20% stocks/80% bonds) was the only one to outperform, gaining 0.04% in September relative to its benchmark that produced an increase of 0.02%. Limited to a 2 bps advantage, the Conservative Portfolio was lifted by the outperformance of the TIAA-CREF Social Choice Bond Fund Retail Shares, down -0.52% relative to -0.53% recorded by the Bloomberg Barclays US Aggregate Index, the positive 1.75% performance impact provided by Vanguard FTSE Social Index Investor Shares and 3.21% return delivered by Domini Impact International Equity Fund Investor Shares even as its exposure in the portfolio is limited to 5%.
On the other hand, the Moderate Sustainable Portfolio (60% stocks/40% bonds) and Aggressive Sustainable Portfolio (95% stocks/5% bonds) posted index lagging returns of 1.08% and 1.98%, respectively. The underperformance in both case was limited to 1 basis point, as their more heavily weighted equity exposures benefited from Domini’s 34 bps outperformance that was offset, in part, by the Vanguard fund’s 12 basis point relative underperformance. Refer to Table 1.

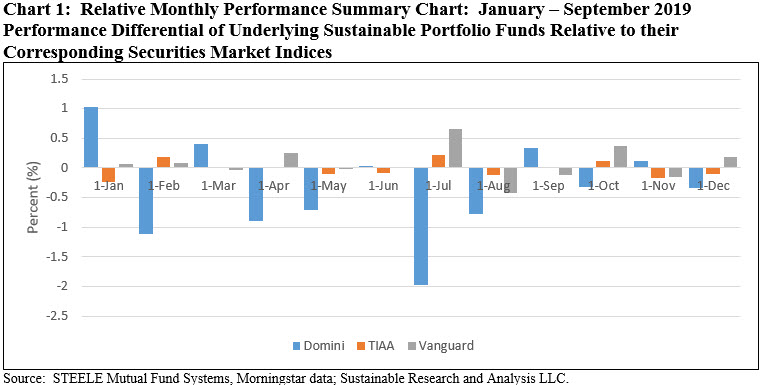
The Domini Impact International Equity Fund Investor Shares performed well this month but had been experiencing a challenging 12-month interval during which the fund underperformed its MSCI EAFE Index in seven of the last 12 months (58% of the time) and led to a 12-month return of -5.58% versus the MSCI EAFE Index (NR) of -1.34%. Refer to Chart 1.

The fund, which in September 2018 further expanded the exclusionary screen on fossil fuels to avoid all companies in the energy sector while also updating its Key Performance Indicators in the automobiles and health care sectors, details the reasons for the fund’s underperformance in its most recently issued annual report as of July 31, 2019 (filed 10/9/2019). The commentary is instructive even as it does not extend to September 2019 but covers the 12-month period ended July 31, 2019 when the fund declined -6.81% versus MSCI EAFE Index (net) which gave up -2.60%:
Security selection was the primary driver of underperformance relative to the MSCI EAFE Index. Weak selection within the consumer staples, industrials and information technology sectors hindered results. Within consumer staples, relative returns were most hurt by not owning Swiss food and beverage company Nestlé†, as well as overweight positions to British supermarkets Sainsbury’s and Morrisons. Strong security selection within the financials and real estate sectors partially offset these negative results.
From an allocation perspective, sector positioning relative to the MSCI EAFE Index slightly benefitted relative results during the period, driven by the Fund’s exclusion of the energy sector, which was the worst performing sector in the benchmark during the period.
From a regional perspective, poor security selection within the United Kingdom, Japan, and other developed markets in Europe detracted from relative results. An out-of-benchmark allocation to emerging markets also detracted from relative performance, driven primarily by exposure to Taiwan and South Korea. This negative impact was partially offset by positive selection within developed Asia-Pacific markets outside Japan.
From a market capitalization standpoint, the Fund’s weak security selection within mid-cap (between $2 billion and $10 billion) and large-cap (between $10 billion and $50 billion) stocks were the primary detractors from relative performance. The Fund’s underweight allocation to mega-cap stocks (greater than $50 billion) also detracted from relative results.
Over the period, the Fund benefitted overall from its exposure to the submanager’s quality (management behavior) theme and both its long-term and short-term momentum themes, most notably in Europe. Additional contributions to Fund performance resulted from an underweight position relative to the MSCI EAFE Index in European bank stocks (specifically not owning UBS†, HSBC and Danske Bank†) and an overweight position in European insurance stocks. Detractors from performance over the period included an underweight to Asian equities relative to the MSCI EAFE Index. Positive exposure to the submanager’s pure value themes in Japan and Europe was the largest detractor to performance.
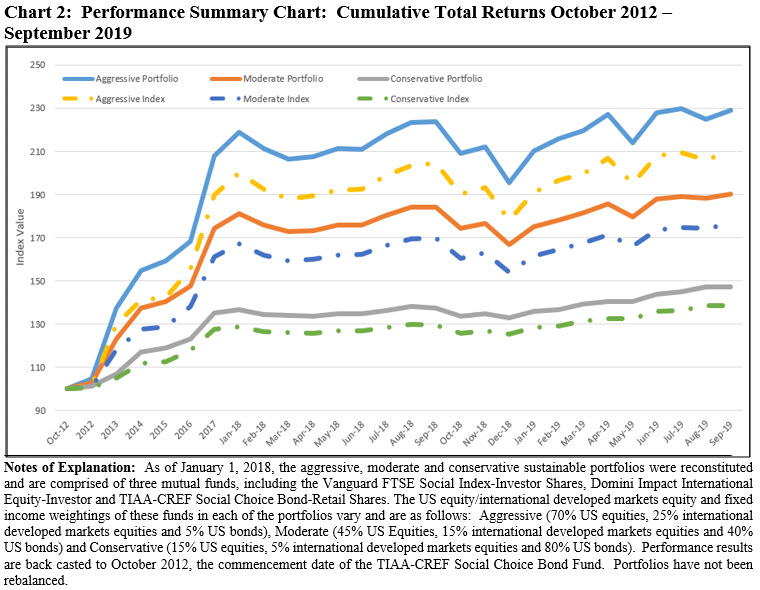
The three portfolios experienced a mixed quarter. Each of the portfolios lagged in August but outperformed in July, resulting in underperformance across the third quarter with margins ranging from 4 bps to 50 bps. The Portfolios also continue to lag behind their conventional indices on a year-to-date and trailing 12-month basis. Still, the three Portfolios continued to outperform their conventional benchmarks since inception as of October 2012 by wide margins. Refer to Chart 2.

Performance of equities and bonds reversed positions in September as large cap equities posted a total return gain of 1.87% while investment-grade intermediate bonds ended the month lower at -0.53%
By way of context for evaluating the market’s performance in September, the stock market advanced as high as 2.84% at the close on September 12th just about a week or so after the US and China set a date for the resumption of trade negotiations in early October. But the sense of optimism engendered by the resumption of trade talks was in part eclipsed in the second half of the month by worries over weaker US economic reports and, in turn, the potential impact on corporate earnings, the surprise introduction of liquidity risk in the overnight funding market as well as domestic political and geopolitical uncertainties. In turn, the stock market paused and turned lower, registering five daily price declines that shaved 1.03% off the S&P 500’s mid-month gain. Still, the US stock market ended on an up note but bonds didn’t do as well, dropping lower. Longer dated Treasury bonds suffered through a -2.56% decline. Small cap stocks weren’t far behind large caps, with the Russell 2000 posting a gain of 1.77% while value stocks across the capitalization continuum outperformed growth stocks, in some cases by wide margins. Foreign stocks did even better, with the MSCI EAFE (Net) Index recording a gain of 2.9% while the MSCI ACWI, ex USA gained 2.6% buoyed by the performance of Japan and India.
Monthly Sustainable Model Portfolios Performance Summary: September 2019
Model portfolios: Two of three sustainable model portfolios were eclipsed by their conventional benchmarks In a month when the performance of equities and bonds reversed positions as large cap equities, tracked by the S&P 500 Index, posted a total return gain of 1.87% while investment-grade intermediate bonds ended the month lower at -0.53% on the…
Share This Article:
Model portfolios: Two of three sustainable model portfolios were eclipsed by their conventional benchmarks
In a month when the performance of equities and bonds reversed positions as large cap equities, tracked by the S&P 500 Index, posted a total return gain of 1.87% while investment-grade intermediate bonds ended the month lower at -0.53% on the back of higher yields, the three sustainable model portfolios with the greatest exposure to equities, both domestic and international, produced results that lagged behind their conventional indices. The Conservative Sustainable Portfolio (20% stocks/80% bonds) was the only one to outperform, gaining 0.04% in September relative to its benchmark that produced an increase of 0.02%. Limited to a 2 bps advantage, the Conservative Portfolio was lifted by the outperformance of the TIAA-CREF Social Choice Bond Fund Retail Shares, down -0.52% relative to -0.53% recorded by the Bloomberg Barclays US Aggregate Index, the positive 1.75% performance impact provided by Vanguard FTSE Social Index Investor Shares and 3.21% return delivered by Domini Impact International Equity Fund Investor Shares even as its exposure in the portfolio is limited to 5%.
On the other hand, the Moderate Sustainable Portfolio (60% stocks/40% bonds) and Aggressive Sustainable Portfolio (95% stocks/5% bonds) posted index lagging returns of 1.08% and 1.98%, respectively. The underperformance in both case was limited to 1 basis point, as their more heavily weighted equity exposures benefited from Domini’s 34 bps outperformance that was offset, in part, by the Vanguard fund’s 12 basis point relative underperformance. Refer to Table 1.
The Domini Impact International Equity Fund Investor Shares performed well this month but had been experiencing a challenging 12-month interval during which the fund underperformed its MSCI EAFE Index in seven of the last 12 months (58% of the time) and led to a 12-month return of -5.58% versus the MSCI EAFE Index (NR) of -1.34%. Refer to Chart 1.
The fund, which in September 2018 further expanded the exclusionary screen on fossil fuels to avoid all companies in the energy sector while also updating its Key Performance Indicators in the automobiles and health care sectors, details the reasons for the fund’s underperformance in its most recently issued annual report as of July 31, 2019 (filed 10/9/2019). The commentary is instructive even as it does not extend to September 2019 but covers the 12-month period ended July 31, 2019 when the fund declined -6.81% versus MSCI EAFE Index (net) which gave up -2.60%:
Security selection was the primary driver of underperformance relative to the MSCI EAFE Index. Weak selection within the consumer staples, industrials and information technology sectors hindered results. Within consumer staples, relative returns were most hurt by not owning Swiss food and beverage company Nestlé†, as well as overweight positions to British supermarkets Sainsbury’s and Morrisons. Strong security selection within the financials and real estate sectors partially offset these negative results.
From an allocation perspective, sector positioning relative to the MSCI EAFE Index slightly benefitted relative results during the period, driven by the Fund’s exclusion of the energy sector, which was the worst performing sector in the benchmark during the period.
From a regional perspective, poor security selection within the United Kingdom, Japan, and other developed markets in Europe detracted from relative results. An out-of-benchmark allocation to emerging markets also detracted from relative performance, driven primarily by exposure to Taiwan and South Korea. This negative impact was partially offset by positive selection within developed Asia-Pacific markets outside Japan.
From a market capitalization standpoint, the Fund’s weak security selection within mid-cap (between $2 billion and $10 billion) and large-cap (between $10 billion and $50 billion) stocks were the primary detractors from relative performance. The Fund’s underweight allocation to mega-cap stocks (greater than $50 billion) also detracted from relative results.
Over the period, the Fund benefitted overall from its exposure to the submanager’s quality (management behavior) theme and both its long-term and short-term momentum themes, most notably in Europe. Additional contributions to Fund performance resulted from an underweight position relative to the MSCI EAFE Index in European bank stocks (specifically not owning UBS†, HSBC and Danske Bank†) and an overweight position in European insurance stocks. Detractors from performance over the period included an underweight to Asian equities relative to the MSCI EAFE Index. Positive exposure to the submanager’s pure value themes in Japan and Europe was the largest detractor to performance.
The three portfolios experienced a mixed quarter. Each of the portfolios lagged in August but outperformed in July, resulting in underperformance across the third quarter with margins ranging from 4 bps to 50 bps. The Portfolios also continue to lag behind their conventional indices on a year-to-date and trailing 12-month basis. Still, the three Portfolios continued to outperform their conventional benchmarks since inception as of October 2012 by wide margins. Refer to Chart 2.
Performance of equities and bonds reversed positions in September as large cap equities posted a total return gain of 1.87% while investment-grade intermediate bonds ended the month lower at -0.53%
By way of context for evaluating the market’s performance in September, the stock market advanced as high as 2.84% at the close on September 12th just about a week or so after the US and China set a date for the resumption of trade negotiations in early October. But the sense of optimism engendered by the resumption of trade talks was in part eclipsed in the second half of the month by worries over weaker US economic reports and, in turn, the potential impact on corporate earnings, the surprise introduction of liquidity risk in the overnight funding market as well as domestic political and geopolitical uncertainties. In turn, the stock market paused and turned lower, registering five daily price declines that shaved 1.03% off the S&P 500’s mid-month gain. Still, the US stock market ended on an up note but bonds didn’t do as well, dropping lower. Longer dated Treasury bonds suffered through a -2.56% decline. Small cap stocks weren’t far behind large caps, with the Russell 2000 posting a gain of 1.77% while value stocks across the capitalization continuum outperformed growth stocks, in some cases by wide margins. Foreign stocks did even better, with the MSCI EAFE (Net) Index recording a gain of 2.9% while the MSCI ACWI, ex USA gained 2.6% buoyed by the performance of Japan and India.
Sustainableinvest.com
Benefits
Free access to regularly updated original research and analysis focused exclusively on sustainable finance and investing, providing investors with the guidance needed to make informed investment decisions that align with their personal values and financial goals while also contributing to the advancement of positive long-term environmental and social outcomes.
By offering financial support for our current work, either in the form of a one-time or regular contributions, you help to defray some of the costs associated with conducting our research and analysis as well as to maintain the www.sustainablest.wpengine.com website.
Helping us to expand our research capabilities and offerings over time to cover additional relevant topics geared to sustainable investors.
Sign up to free newsletters.
By submitting this form, you are consenting to receive marketing emails from: . You can revoke your consent to receive emails at any time by using the SafeUnsubscribe® link, found at the bottom of every email. Emails are serviced by Constant Contact