Sustainable Funds Close May at $283.9 Billion, Adding $3.3 Billion and Two New Funds
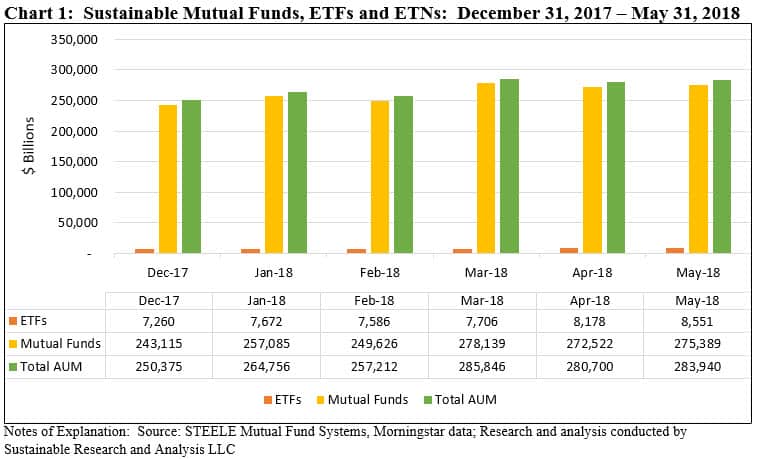
The net assets of 965 sustainable funds and share classes, including 323 mutual funds, 71 exchange-traded funds (ETFs) and one exchange-traded note (ETN), ended the month of May at $283.9 billion versus $280.7 billion at the end of April, representing an increase of $3.3 billion or 1.2%. This also compares to $250.4 billion in sustainable fund assets at year-end 2017. Refer to Chart 1.

[ihc-hide-content ihc_mb_type=”show” ihc_mb_who=”reg” ihc_mb_template=”4″ ]
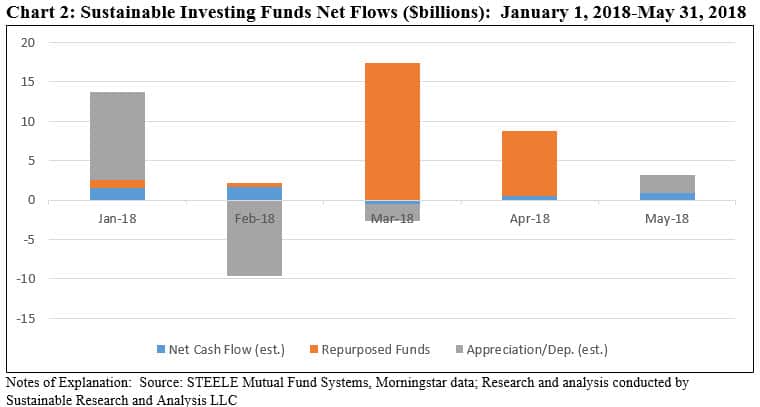
An estimated $2.3 billion of the increase is attributable to the changes in the market value of portfolio securities. At the same time, the universe of sustainable funds experienced approximately $900 million in net inflows, representing 38% of the month’s increase and 0.32% of the total monthly uptick for the segment relative to April. This increase also reflects the addition of one newly launched sustainable fund into the segment as well as the introduction of an ETF that was launched in January 2018.
Mutual funds ended May with $275.4 billion in net assets, accounting for 97% of the sustainable segment’s assets, while ETFs/ETNs closed May with $8.6 billion in net assets. Sustainable fixed income funds, including corporate funds, municipal funds and money market funds held $20.4 billion in assets while all other funds, including equity funds, continue to dominate with $263.5 billion in assets. These allocations were largely unchanged month-over-month.
This is also the case with regard to assets sourced to institutional only funds versus all other funds, which ended the month of May with $91.0 billion and $192.9 billion, respectively.
May Net Cash Flows Dominated by Market Movements
Within a universe of 956 sustainable funds, including mutual funds and their corresponding share classes, ETFs and ETNs, returns for the month of May averaged 0.78%. These ranged from a low of -11.24% to a high of 10.42%.
Against this backdrop, sustainable funds, as noted above, ended the month of May at $283.9 billion versus $280.7 billion at the end of April, representing an increase of $3.3 billion or 1.2%.
An estimated $2.3 billion is attributable to market appreciation and approximately $900 million is sourced to net inflows. Refer to Chart 2. This increase also reflected the addition of one new fund into the segment, the $7.3 million Goldman Sachs ESG Emerging Markets Equity Fund offering six share classes whose net assets were largely sourced to the fund’s institutional share class as well as the addition of the $27.4 million InsightShares LGBT Employment Equality ETF listed for trading by UBS as of January 2018.

Composition of Top 20 Sustainable Fund Groups Shifts During the Month
A total of 113 fund groups offered designated sustainable investing products at the end of May. This compares to 114 fund groups at the end of April 2018, a net reduction of one due to the consolidation of funds offered by Invesco and PowerShares that were previously reported individually along with the consolidation of Guggenheim’s ETFs into the Invesco brand following the Invesco’s acquisition of this business. At the same time, the $27.4 million InsightShares LGBT Employment Equality ETF listed for trading by UBS as of January 2018 was added to the data-base.
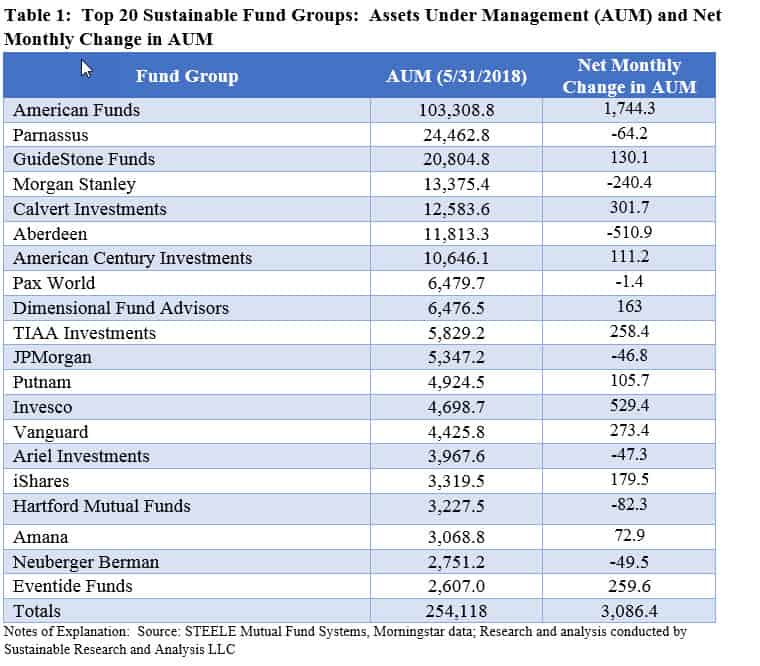
Within the universe of 113 fund groups, the top 20 groups accounted for $254.1 billion in sustainable assets, or 89.5% of the segment’s total assets. Domini Impact Investments, a firm dedicated to sustainable investing and one of the oldest firms operating in this sphere, was squeezed out of its top 20 spot due to the previously mentioned consolidation of Invesco, PowerShares as well as Guggenheim. Domini shifted into 21st position with almost $2.4 billion in assets. Domini’s position, which is more generally being supplanted by traditional investment management firms that have been introducing sustainable funds, was the 16th largest sustainable firm at the end of 2016 and 17th largest at the end of 2017. On the other hand, the combined Invesco/PowerShares/Guggenheim fund offerings, a total of 10 mutual funds and ETFs with almost $4.7 billion in assets, moved up to the 13th position. Refer to Table 1.

The top 10 funds group remains unchanged, however Calvert Investments moved ahead of Aberdeen to take up the number five ranking from the previous month’s ranking as number six. On a combined basis, this segment controls $215.8 billion in assets which represents 76% of net assets.
Largest Monthly Gains/Declines Recorded by Fund Groups
The top 20 sustainable fund groups experienced a $2.5 billion increase in net assets, ranging from a gain of $1.7 billion realized by American Funds, followed by increases recorded by Invesco which added $529.4 million and Calvert Investments that saw an increase of $301.7 million. At the other end of the range were Aberdeen whose sustainable assets declined by $510.9 million, followed by Morgan Stanley whose assets dropped by $240.4 million and Hartford Mutual Funds that saw its assets decline by $82.3 million. Refer to Table 1.
Largest Monthly Gains Recorded by Fund Groups: American Funds, Invesco and Calvert
• The largest monthly gain in May at $1.7 billion was realized by American Funds’ Washington Mutual Fund, a fund offered by American Funds that excludes companies that derive a majority of their revenues from alcohol or tobacco products.
• The second largest monthly gain was attributable to technical reasons as Invesco consolidated the assets acquired by Guggenheim. This transactions also added to its fold the renamed Invesco Solar ETF with $419 million in assets.
• In turn, this was followed by three funds offered by Calvert Investments that gained a combined total of $115.1 million. These include: Calvert Emerging Markets Equity Fund-I Shares ($46.4 million), US Large Cap Calvert US Large Cap Core Responsible Index Fund-I Shares ($42.8 million) and Calvert US Large Cap Core Value Responsible Index Fund ($25.9 million).
Largest Monthly Declines Recorded by Fund Groups: Aberdeen, Morgan Stanley and Hartford Mutual Funds
• Aberdeen saw its sustainable assets decline by $510.9 million primarily because of a drop of $468 million realized in the Aberdeen Emerging Markets Fund-Institutional Shares.
• Morgan Stanley’s Institutional International Equity Fund-IS Shares recorded an outflow of $366.8 million, which was offset by gains and losses within its 17 identified sustainable funds platform.
• Finally, Hartford Mutual Funds posted a $67.2 million drop in net assets reported at the end of May in three share classes that are offered by the Hartford Schroders Emerging Markets Fund.
New Fund Launched by Goldman Sachs: Goldman Sachs ESG Emerging Markets Equity Fund
The newly launched Goldman Sachs ESG Emerging Markets Equity Fund invests in a diversified portfolio of equity investments in emerging country issuers that Goldman believes adhere to the fund’s environmental, social and governance (ESG) criteria. The fund’s ESG criteria are generally designed to exclude companies with weak corporate governance, and/or companies that are involved in, and/or derive significant revenue from, certain industries or product lines, including: gambling, alcohol, tobacco, coal and weapons. Once Goldman determines that an issuer meets the fund’s ESG criteria, further supplemental analysis is conducted on each individual companies’ corporate governance factors and a range of environmental and social factors that may vary by sector. This supplemental analysis will be conducted alongside traditional fundamental, bottom-up financial analysis of individual companies, using traditional fundamental metrics. The Investment Adviser engages in active dialogues with company management teams to further inform investment decision-making and to foster best corporate governance practices using its fundamental and ESG analysis.


