The Bottom Line: Green bond funds reversed a slide in net assets, helped by posting the narrowest average monthly total return performance drop this year.
May Summary
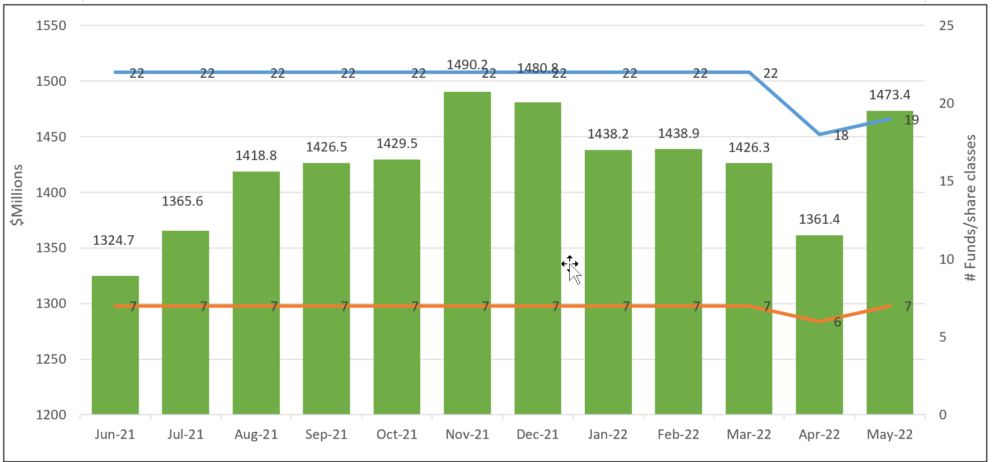
- Dedicated green bond funds, which rebounded to seven funds on May 3rd upon the launch of the rebranded Franklin Municipal Green Bond ETF (FMLB)¹ that shifted $101.9 million into the green bonds segment, reached $1,473 million in net assets at the end of May. Refer to Chart 1. The segment, which is dominated by institutional investors, gained $112 million, or 8.2%, including the assets attributable to FMLB. Excluding FMLB, assets increased by $10.1 due to net positive flows attributable almost entirely to $29.6 million gained by iShares USD Green Bond ETF (BGRN).
- Testing the resolve of green bond fund investors, green bond funds continued to struggle in May but managed to post the narrowest average total return drop so far this year. The segment of seven funds posted an average decline of 0.28% in May versus a 0.64% gain recorded by the Bloomberg US Aggregate Bond Index and a negative 1.36% registered by the ICE BofAML Green Bond Index Hedged US Index. There was a performance divide between the three funds that invest in US dollar denominated green debt versus those funds that invest in non-US dollar denominated debt and take on currency exposure. The three, including Franklin Municipal Green Bond ETF (FMLB), iShares US Green Bond ETF (BGRN) and VanEck Green Bond ETF (GRNB), each registered positive returns in May. Refer to Table 1.
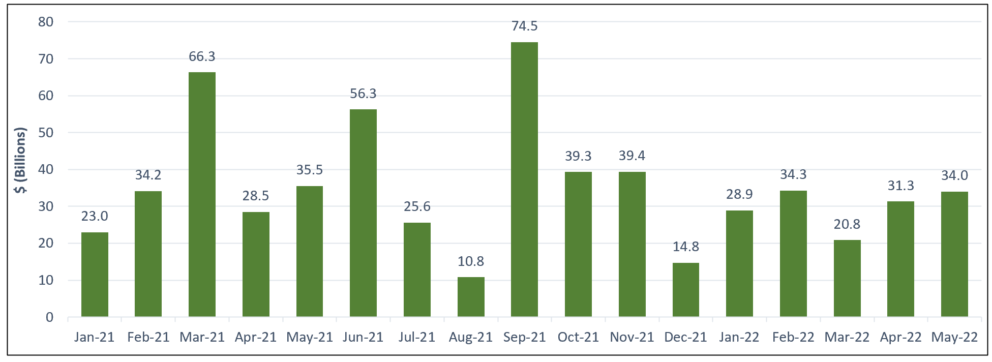
- Consistent with the decline in global bond issuance so far this year, green bond volume year-to-date has fallen behind 2021. According to data compiled by the Climate Bond Initiative, $149.4 billion in green bonds were issued through May of this year versus $187.5 billion during the equivalent time interval last year. Refer to Chart 2. Volume is expected to be bolstered by sovereign green bonds. Austria sold its first ever green bond in May while France issued its first ever inflation-linked green bond. According to reports, the Netherlands is expected to reopen its green bond later in June, Greece’s first green bond and a new green bond from Germany are expected in the second half of 2022 and more generally, the European Commission’s plan (“REPowerEU) to cut its reliance on Russian energy and slash imports of Russian oil is expected to stimulate the issuance of green bonds.
Chart 1: Green bond mutual funds and ETFs and assets under management – June 2021 – May 31, 2022
Notes of Explanation: Franklin Municipal Green Blond Fund and tis four share classes with total net assets of $9.7 million included in the data. At the same time, the rebranded Franklin Liberty Federal Tax-Free Bond ETF renamed the Franklin Municipal Green Bond ETF is excluded as of April 29, 2022. Fund total net assets data source: Morningstar Direct; fund filings. Research and analysis by Sustainable Research and analysis LLC
Chart 2: Issuance of green bonds: January 1, 2021 – May 31, 2022
Notes of Explanation: Volumes data varies by data source and may be preliminary. Source: Climate Bond Initiative (CBI)
Table 1: Green bond funds: Performance results, expense ratios and AUM-May 31, 2022
Name | Symbol | 1-Month Return (%) | 3-Month Return (%) | 12-Month Return (%) | 3-Year Average Return (%) | 5-Year Average Return (%) | $Assets (millions) | Expense Ratio (%) |
Calvert Green Bond A | CGAFX | -0.07 | -5.39 | -8.94 | -0.31 | 0.9 | 76.7 | 0.73 |
Calvert Green Bond I | CGBIX | -0.04 | -5.32 | -8.7 | -0.06 | 1.19 | 734.6 | 0.48 |
Calvert Green Bond R6 | CBGRX | -0.04 | -5.3 | -8.65 | 0.01 | 41.1 | 0.43 | |
Franklin Municipal Green Bond ETF | FLMB | 1.4 | -6.17 | -9.29 | 0.14 | 108 | 0.3 | |
iShares USD Green Bond ETF | BGRN | 0.51 | -5.78 | -9.36 | -0.87 | 274.7 | 0.2 | |
Mirova Global Green Bond A | MGGAX | -1.55 | -6.57 | -11.39 | -1.22 | 0.58 | 6.6 | 0.94 |
Mirova Global Green Bond N | MGGNX | -1.54 | -6.58 | -11.17 | -0.91 | 0.88 | 4.9 | 0.64 |
Mirova Global Green Bond Y | MGGYX | -1.55 | -6.51 | -11.22 | -0.95 | 0.82 | 29.6 | 0.69 |
PIMCO Climate Bond A | PCEBX | -0.5 | -5.42 | -8.99 | 0.8 | 0.94 | ||
PIMCO Climate Bond C | PCECX | -0.56 | -5.6 | -9.68 | 0 | 1.69 | ||
PIMCO Climate Bond I-2 | PCEPX | -0.48 | -5.34 | -8.71 | 0.5 | 0.64 | ||
PIMCO Climate Bond I-3 | PCEWX | -0.48 | -5.36 | -8.76 | 0.1 | 0.69 | ||
PIMCO Climate Bond Institutional | PCEIX | -0.47 | -5.32 | -8.62 | 11 | 0.54 | ||
TIAA-CREF Green Bond Advisor | TGRKX | -0.07 | -5.93 | -8.48 | 0.57 | 3.1 | 0.55 | |
TIAA-CREF Green Bond Institutional | TGRNX | -0.06 | -5.93 | -8.46 | 0.59 | 74.1 | 0.45 | |
TIAA-CREF Green Bond Premier | TGRLX | -0.08 | -5.96 | -8.59 | 0.46 | 1 | 0.6 | |
TIAA-CREF Green Bond Retail | TGROX | -0.09 | -6 | -8.8 | 0.31 | 7.3 | 0.78 | |
TIAA-CREF Green Bond Retirement | TGRMX | -0.08 | -5.96 | -8.67 | 0.45 | 14.7 | 0.7 | |
GRNB | 0.35 | -5.24 | -9.37 | -0.28 | 0.31 | 84.6 | 0.2 | |
Average/Total | -0.28 | -5.77 | -9.26 | -0.15 | 0.78 | 1,473.4 | 0.64 | |
Bloomberg US Aggregate Bond Index | 0.64 | -5.86 | -8.22 | 0 | 1.18 | |||
Bloomberg Global Aggregate Bond Index | 0.27 | -8.11 | -13.21 | -1.44 | 0.08 | |||
Bloomberg Municipal Total Return Index | 1.49 | -4.52 | -6.79 | 0.5 | 1.78 | |||
S&P Green Bond US Dollar Select IX | 0.4 | -5.15 | -9.16 | 0.09 | 1.27 | |||
ICE BofAML Green Bond Index Hedged US Index | -1.36 | -7.27 | -10.75 | -1.13 | 1.12 |
Notes of Explanation: Blank cells=NA. 3 and 5-year returns are average annual total returns. *Fund invests in foreign currency bonds and performance should also be compared to a more narrowly based relevant index such as the ICE BofAML Green Blond Index Hedged US or equivalent. ** Fund invests in US dollar denominated green bonds only and performance should also be compared to a more narrowly based relevant index such as the S&P Green Bond US Dollar Select Index or equivalent. ^Effective March 1, 2022, fund shifted to US dollar green bonds. Fund total net assets and performance data source: Morningstar Direct; fund filings. Research and analysis by Sustainable Research and Analysis LLC


