Research and analysis to keep sustainable investors up to-date on a broad range of topics that include trends and developments in sustainable investing and sustainable finance, regulatory updates, performance results and considerations, investing through index funds and actively managed portfolios, asset allocation updates, expenses, ESG ratings and data, company and product news, green, social and sustainable bonds, green bond funds as well as reporting and disclosure practices, to name just a few.
A continuously updated Funds Directory is also available to investors. This is intended to become a comprehensive listing of sustainable mutual funds, ETFs and other investment products along with a description of their sustainable investing approaches as set out in fund prospectuses and related regulatory filings.
Many questions have surfaced in recent years regarding sustainable and ESG investing. Here, investors and financial intermediaries will find materials that describe the various approaches to sustainable investing and their implementation. While sustainable investing approaches vary and they have thus far defied universally accepted definitions, many practitioners agree that they fall into the following broad categories: Values-based investing, investing via exclusions, impact investing, thematic investments and ESG integration. In conjunction with each of these approaches, investors may also adopt various issuer engagement procedures and proxy voting practices. That said, sustainable investing approaches will continue to evolve.
In addition to periodic updates regarding sustainable investing and how this form of investing is evolving, investors and financial intermediaries interested in implementing a sustainable investing approach will also find source materials that cover basic investing themes as well as asset allocation tactics.
Thoughts and ideas targeting sustainable investing strategies executed through various registered and non-registered sustainable investment funds and products such as mutual funds, Exchange Traded Funds (ETFs), Exchange Traded Notes (ETNs), closed-end funds, Real Estate Investment Trusts (REITs) and Unit Investment Trusts (UITs). Coverage extends to investment management firms as well as fund groups.
May 2019 Sustainable Investment Funds Performance Scorecard
Summary Longer-term higher quality bond funds were the best performing fixed income funds in May while emerging market and high yield bond funds lagged behind. Returns ranged from a high of 4.32% to a low of -1.82%.
Share This Article:
Summary
Longer-term higher quality bond funds were the best performing fixed income funds in May while emerging market and high yield bond funds lagged behind. Returns ranged from a high of 4.32% to a low of -1.82%.
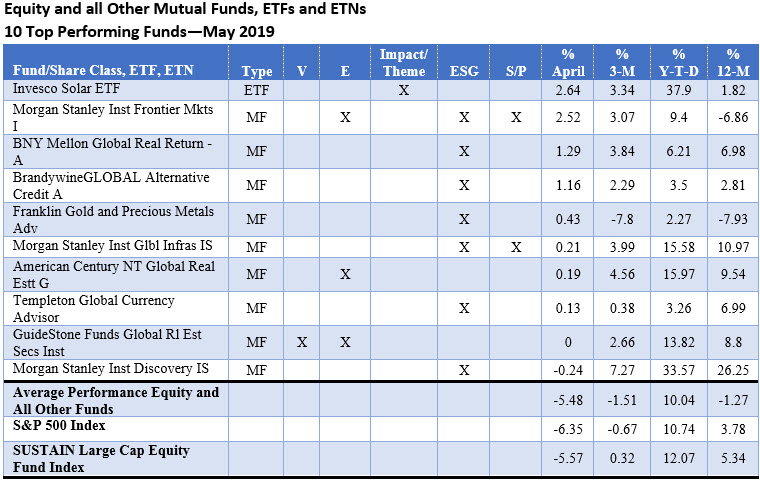
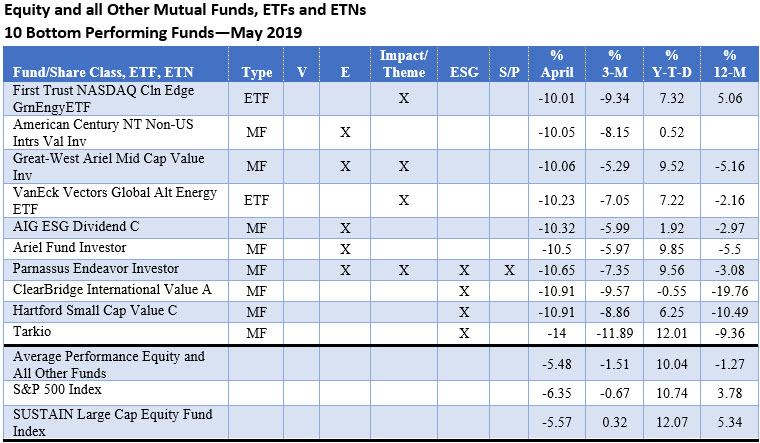
In a challenging month for equities, the leading funds in the equity and all other funds segment included mutual funds and exchange-traded funds invested in solar energy (but apparently not clean or alternative energy more generally), gold and precious metals as well as global real estate. Funds in these categories produced some of the very few positive results in May, as high as 2.64% while small cap and value funds recorded the worst results, as low as -14%, in one instance.
Funds employing ESG integration strategies, either exclusively or in combination with exclusions and shareholder/bondholder engagement, dominated the leaders and laggards tables. Funds employing exclusionary strategies, either exclusively or in combination with other strategies, comprised the second most common sustainable strategy among the leading and lagging funds in May.
May Performance Scorecards
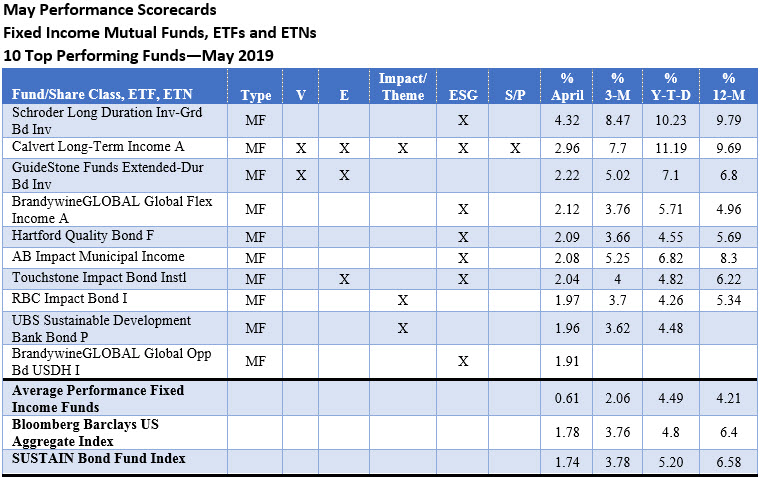
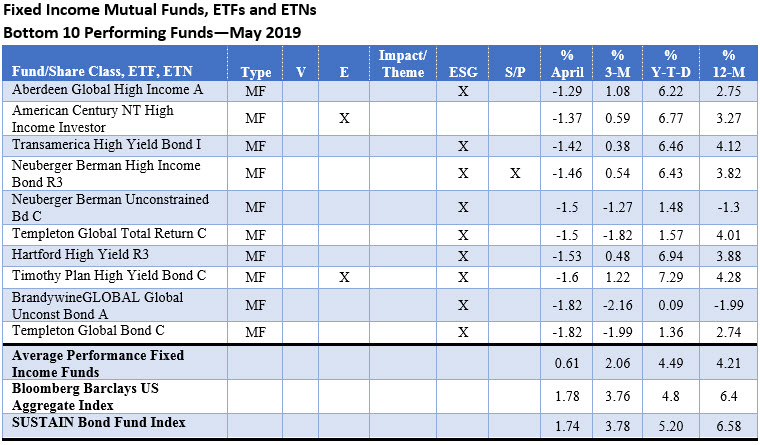
Notes of Explanation covering fixed income funds. Results are total returns. Fixed income funds include short and long-term taxable and tax-exempt bond funds and ETFs, a total of 515 funds/share classes, ETFs, ETNs with performance for the full month of May 2019. Blanks for other time periods indicate that the fund was not in operations during the entire time interval. Top 10 defined as top 10 funds, excluding multiple share classes of the same fund (i.e. if more than one share class landed in the top of bottom listing of the 10 funds only the best performing one fund/share class is included. V=Values-based strategy, E=Exclusionary strategy, Impact/Theme=Impact and/or thematic strategy, ESG=environmental, social, governance integration, S/P=shareholder/bondholder engagement and proxy voting. Sources: STEELE Mutual Fund Expert, Morningstar data and Sustainable Research and Analysis.
Notes of Explanation covering equity and all other funds: Results are total returns. Equity funds include all US and international equity as well as all other funds, except for fixed income funds, a total of 1,616 funds/share classes, ETFs, ETNs with performance for the full month of May 2019. Blanks for other time periods indicate that the fund was not in operations during the entire time interval. Top 10 defined as top 10 funds, excluding multiple share classes of the same fund (i.e. if more than one share class landed in the top of bottom listing of the 10 funds only the best performing one fund/share class is included. V=Values-based strategy, E=Exclusionary strategy, Impact/Theme=Impact and/or thematic strategy, ESG=environmental, social, governance integration, S/P=shareholder/bondholder engagement and proxy voting.
Sources: STEELE Mutual Fund Expert, Morningstar data and Sustainable Research and Analysis.
Sustainableinvest.com
Benefits
Free access to regularly updated original research and analysis focused exclusively on sustainable finance and investing, providing investors with the guidance needed to make informed investment decisions that align with their personal values and financial goals while also contributing to the advancement of positive long-term environmental and social outcomes.
By offering financial support for our current work, either in the form of a one-time or regular contributions, you help to defray some of the costs associated with conducting our research and analysis as well as to maintain the www.sustainablest.wpengine.com website.
Helping us to expand our research capabilities and offerings over time to cover additional relevant topics geared to sustainable investors.
Sign up to free newsletters.
By submitting this form, you are consenting to receive marketing emails from: . You can revoke your consent to receive emails at any time by using the SafeUnsubscribe® link, found at the bottom of every email. Emails are serviced by Constant Contact