The S&P 500 Index gained 8.01%, posting the best monthly results since October 2015
The S&P 500 Index and the Dow Jones Industrial Average gained 8.01% and 7.30%, respectively, posting the best monthly results since October 2015 and helping to erase all but about 1.2% of December’s 9.2% decline in the case of the broader S&P 500. All eleven sectors that make up the S&P index registered gains that ranged from 3.57% for Utilities to a high of 12.48% achieved by Industrials. The turnaround in stocks is being attributed to a shift in the stance of the Federal Reserve Board’s Chairman Jerome Powell based on remarks made on January 4, 2019 that the central bank would be patient before raising interest rates further. This came about two weeks after the Federal Open Market Committee hiked rates by one-quarter of a percentage point to a range of 2.25% to 2.5% while also indicating that rates were anticipated to rise at least twice in 2019. The Fed’s modified posture was also reflected in comments that the central bank might also be flexible regarding the pace with which it would reduce its balance sheet which had been shrinking by as much as $50 billion a month. The Fed’s position was reinforced following the two-day January 29-30 FOMC meeting when it was announced that a decision was reached to maintain the target range for the federal funds rate at 2.25% to 2.5%. In response, 10-year Treasury yields dropped to end the month at 2.63%, down 6 basis points from the close of 2.69% at year-end 2018 while the Bloomberg Barclays US Aggregate Index gained 1.06%. This elevated the trailing 12-month return for investment-grade intermediate bonds to 2.25% versus -2.31% for the S&P 500 Index. High yield bonds rose 4.39%.
There was also a recovery in Asian and European stocks in January, with the MSCI AC, ex-Japan GR Index and MSCI EAFE NR Index registering gains of 7.29% and 6.57%, respectively, even as Europe and China’s economies are facing headwinds. These strong gains were still eclipsed by a double digit increase of 14.52% achieved in Latin America, according to the S&P Latin America 40 Total Return Index. In general, growth stocks outperformed value stocks while small capitalization stocks, especially micro-cap stocks, exceeded the performance large and mid-cap stocks.
Sustainable mutual funds and ETFs gain an average of 6.96% in January
Sustainable funds, on average, generated strong results in January. 1,319 funds ranging from money market funds to equity funds posted an average gain of 6.96% with only a single fund recording a negative return. This was the small and very volatile iPath Global Carbon ETN that was down -11.27% while the best performing fund was the Invesco Solar ETF. The fund was up 24.8%, reversing a decline of 26.2in 2018 as solar stocks suffered from a cyclical downturn. This came ahead of the announcement by NASA scientists on February 6, 2019 that the Earth’s average surface temperature in 2018 was the fourth highest in nearly 140 years of record-keeping and a continuation of an unmistakable warming trend.
Reconstituted Sustainable (SUSTAIN) Large Cap Equity Fund Index up 7.6% but lags S&P 500 by 36 bps
The Sustainable (SUSTAIN) Large Cap Equity Fund Index was reconstituted as of December 31, 2018 to reflect changes that occurred during 2018 in the profile of the sustainable US equity universe of mutual funds due to the expansion in the number of funds offered in this market segment by mainstream investment management firms and the expansion in the universe of available like funds from which to select the ten index constituents. As a result, the index was reconstituted to reflect the substitution of three large funds. These include the JPMorgan U.S. Equity Fund R6, Pioneer A and Putnam Sustainable Leaders A. These three funds replace Dreyfus Sustainable US Equity Fund Z, Parnassus Fund and Parnassus Endeavor Fund Investor Shares.
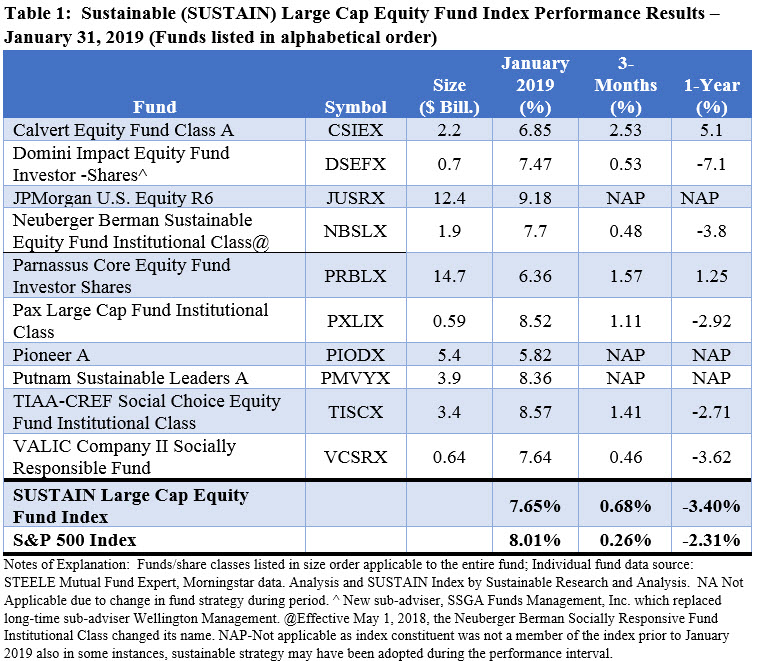
The reconstituted SUSTAIN Large Cap Equity Fund Index posted a gain of 7.6% in January, the best monthly result since the index was started as of December 31, 2016, but lagged behind the S&P 500 by 36 basis points. Four of the 10 index constituents posted results in excess of the S&P 500 and returns ranged from a high of 9.18% recorded by the JPMorgan U.S. Equity Fund R6 class to a low of 5.82% posted by Pioneer A. The JPMorgan U.S. Equity Fund benefited from a slight growth tilt in January and its fully invested position of about 99% of net assets at the start of 2019. With the exception of 2% variations from the S&P 500 in the Health Care and Consumer Defense sectors which may have detracted from the fund’s performance, above index positions in Microsoft Corp. (MSFT), Amazon.com (AMZN) and Alphabet Inc. (GOOGL) contributed to the fund’s excess return in January. Refer to Table 1.

Not a new investment vehicle, the JPMorgan U.S. Equity Fund commenced operations in 2001 and was repurposed as of November 1, 2018 by adopting prospectus language indicating that as part of its investment process “the adviser seeks to assess the impact of environmental, social and governance factors (including accounting and tax policies, disclosure and investor communication, shareholder rights and remuneration policies) on the cash flows of many companies in which it may invest to identify issuers that the adviser believes will be negatively impacted by such factors relative to other issuers.” With its updated mandate, the JPMorgan U.S. Equity Fund now stands as the third largest in the sustainable US equity segment, after only Washington Mutual at $48.9 billion (which does not qualify for inclusion in the index since it relies entirely on exclusions) and the $14.7 billion Parnassus Core Equity Fund that remains an index constituent.
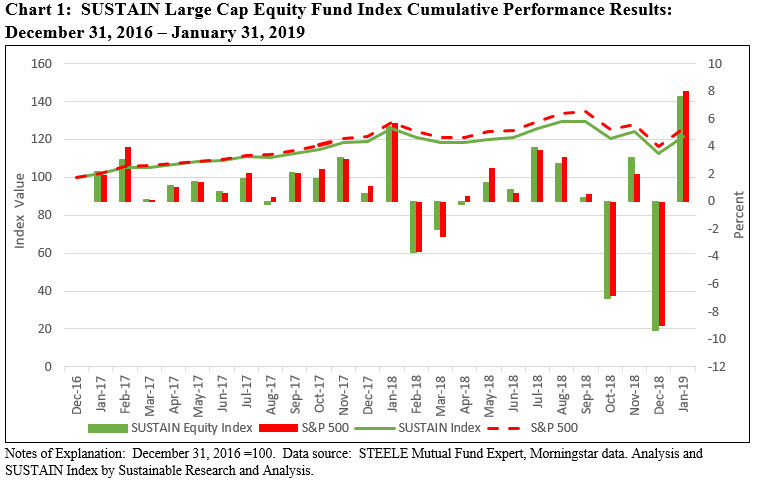
The SUSTAIN Large Cap Equity Fund Index posted 3-month and trailing 12-month results of 0.68% and -3.40% versus the S&P 500 Index 0.26% and -2.31%, respectively. Refer to Chart 1.

The Sustainable (SUSTAIN) Fixed Income Indicator upgraded to an index and posts gain of 1.2% versus 1.06% for the Bloomberg Barclays US Aggregate Index
The SUSTAIN Fixed Income Indicator was upgraded to an index with the addition of five actively managed sustainable fixed income funds that are pursuing investment-grade intermediate term mandates in line with the Bloomberg Barclays US Aggregate Index that, at the same time, employ a sustainable investing strategy beyond absolute reliance on exclusionary practices for religious, ethical or social reasons. Here too, the upgrade reflects changes that occurred during 2018 in the profile of the sustainable taxable fixed income universe of mutual funds due to the expansion in the number of funds offered in this market segment by mainstream investment management firms and the expansion in the universe of available like funds.
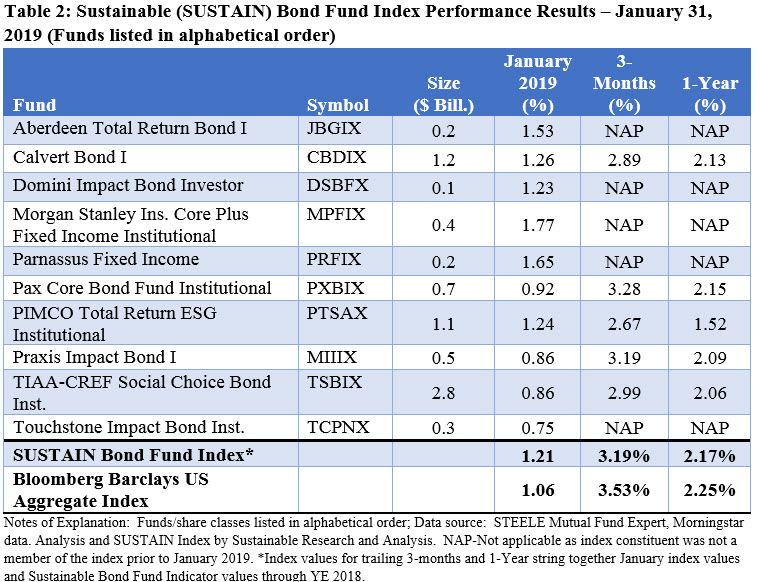
The SUSTAIN Fixed Income Index now consists of the ten largest qualifying funds, including the following mutual funds/share classes that have been added as of December 31, 2018: Morgan Stanley Institutional Core Plus Fixed Income Institutional Shares, Touchstone Impact Bond Institutional, Aberdeen Total Return Bond I, Parnassus Fixed Income and Domini Impact Bond Investor. Refer to Table 2.

After a strong December, the SUSTAIN Bond Fund Index posted an increase of 1.2% in January, exceeding the Bloomberg Barclays US Aggregate Index by 15 basis points. Positive contributions to the outperformance of the index were made by six funds that achieved excess index returns, led by the 1.77% posted by the Morgan Stanley Institutional Core Plus Fixed Income Institutional Fund. The fund, which maintained an average BB credit quality, benefited from its above index allocation of 25.17% to non-investment grade or non-rated bonds as high yield bonds eclipsed investment-grade bonds by over 4X. This level compares a limited 2.63% exposure to such securities and an average single A credit quality position maintained by the lowest performing Touchstone Impact Bond Institutional Fund that recorded a gain of 0.75% in January.
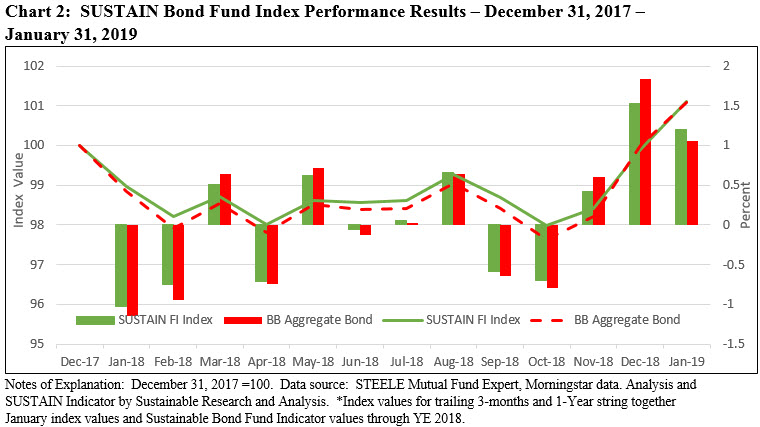
The SUSTAIN Bond Fund Index, when combined with Indicator values through year-end 2018, is up 3.19% for the trailing 3-months and 2.17% for the trailing one-year. Refer to Chart 2.

For SUSTAIN Equity and Bond Fund Index explanations, refer to article entitled Sustainable (SUSTAIN) Equity and Bond Fund Indexes Explained.
Markets soar in January 2019 as did sustainable equity and bond funds
The S&P 500 Index gained 8.01%, posting the best monthly results since October 2015 The S&P 500 Index and the Dow Jones Industrial Average gained 8.01% and 7.30%, respectively, posting the best monthly results since October 2015 and helping to erase all but about 1.2% of December’s 9.2% decline in the case of the broader…
Share This Article:
The S&P 500 Index gained 8.01%, posting the best monthly results since October 2015
The S&P 500 Index and the Dow Jones Industrial Average gained 8.01% and 7.30%, respectively, posting the best monthly results since October 2015 and helping to erase all but about 1.2% of December’s 9.2% decline in the case of the broader S&P 500. All eleven sectors that make up the S&P index registered gains that ranged from 3.57% for Utilities to a high of 12.48% achieved by Industrials. The turnaround in stocks is being attributed to a shift in the stance of the Federal Reserve Board’s Chairman Jerome Powell based on remarks made on January 4, 2019 that the central bank would be patient before raising interest rates further. This came about two weeks after the Federal Open Market Committee hiked rates by one-quarter of a percentage point to a range of 2.25% to 2.5% while also indicating that rates were anticipated to rise at least twice in 2019. The Fed’s modified posture was also reflected in comments that the central bank might also be flexible regarding the pace with which it would reduce its balance sheet which had been shrinking by as much as $50 billion a month. The Fed’s position was reinforced following the two-day January 29-30 FOMC meeting when it was announced that a decision was reached to maintain the target range for the federal funds rate at 2.25% to 2.5%. In response, 10-year Treasury yields dropped to end the month at 2.63%, down 6 basis points from the close of 2.69% at year-end 2018 while the Bloomberg Barclays US Aggregate Index gained 1.06%. This elevated the trailing 12-month return for investment-grade intermediate bonds to 2.25% versus -2.31% for the S&P 500 Index. High yield bonds rose 4.39%.
There was also a recovery in Asian and European stocks in January, with the MSCI AC, ex-Japan GR Index and MSCI EAFE NR Index registering gains of 7.29% and 6.57%, respectively, even as Europe and China’s economies are facing headwinds. These strong gains were still eclipsed by a double digit increase of 14.52% achieved in Latin America, according to the S&P Latin America 40 Total Return Index. In general, growth stocks outperformed value stocks while small capitalization stocks, especially micro-cap stocks, exceeded the performance large and mid-cap stocks.
Sustainable mutual funds and ETFs gain an average of 6.96% in January
Sustainable funds, on average, generated strong results in January. 1,319 funds ranging from money market funds to equity funds posted an average gain of 6.96% with only a single fund recording a negative return. This was the small and very volatile iPath Global Carbon ETN that was down -11.27% while the best performing fund was the Invesco Solar ETF. The fund was up 24.8%, reversing a decline of 26.2in 2018 as solar stocks suffered from a cyclical downturn. This came ahead of the announcement by NASA scientists on February 6, 2019 that the Earth’s average surface temperature in 2018 was the fourth highest in nearly 140 years of record-keeping and a continuation of an unmistakable warming trend.
Reconstituted Sustainable (SUSTAIN) Large Cap Equity Fund Index up 7.6% but lags S&P 500 by 36 bps
The Sustainable (SUSTAIN) Large Cap Equity Fund Index was reconstituted as of December 31, 2018 to reflect changes that occurred during 2018 in the profile of the sustainable US equity universe of mutual funds due to the expansion in the number of funds offered in this market segment by mainstream investment management firms and the expansion in the universe of available like funds from which to select the ten index constituents. As a result, the index was reconstituted to reflect the substitution of three large funds. These include the JPMorgan U.S. Equity Fund R6, Pioneer A and Putnam Sustainable Leaders A. These three funds replace Dreyfus Sustainable US Equity Fund Z, Parnassus Fund and Parnassus Endeavor Fund Investor Shares.
The reconstituted SUSTAIN Large Cap Equity Fund Index posted a gain of 7.6% in January, the best monthly result since the index was started as of December 31, 2016, but lagged behind the S&P 500 by 36 basis points. Four of the 10 index constituents posted results in excess of the S&P 500 and returns ranged from a high of 9.18% recorded by the JPMorgan U.S. Equity Fund R6 class to a low of 5.82% posted by Pioneer A. The JPMorgan U.S. Equity Fund benefited from a slight growth tilt in January and its fully invested position of about 99% of net assets at the start of 2019. With the exception of 2% variations from the S&P 500 in the Health Care and Consumer Defense sectors which may have detracted from the fund’s performance, above index positions in Microsoft Corp. (MSFT), Amazon.com (AMZN) and Alphabet Inc. (GOOGL) contributed to the fund’s excess return in January. Refer to Table 1.
Not a new investment vehicle, the JPMorgan U.S. Equity Fund commenced operations in 2001 and was repurposed as of November 1, 2018 by adopting prospectus language indicating that as part of its investment process “the adviser seeks to assess the impact of environmental, social and governance factors (including accounting and tax policies, disclosure and investor communication, shareholder rights and remuneration policies) on the cash flows of many companies in which it may invest to identify issuers that the adviser believes will be negatively impacted by such factors relative to other issuers.” With its updated mandate, the JPMorgan U.S. Equity Fund now stands as the third largest in the sustainable US equity segment, after only Washington Mutual at $48.9 billion (which does not qualify for inclusion in the index since it relies entirely on exclusions) and the $14.7 billion Parnassus Core Equity Fund that remains an index constituent.
The SUSTAIN Large Cap Equity Fund Index posted 3-month and trailing 12-month results of 0.68% and -3.40% versus the S&P 500 Index 0.26% and -2.31%, respectively. Refer to Chart 1.
The Sustainable (SUSTAIN) Fixed Income Indicator upgraded to an index and posts gain of 1.2% versus 1.06% for the Bloomberg Barclays US Aggregate Index
The SUSTAIN Fixed Income Indicator was upgraded to an index with the addition of five actively managed sustainable fixed income funds that are pursuing investment-grade intermediate term mandates in line with the Bloomberg Barclays US Aggregate Index that, at the same time, employ a sustainable investing strategy beyond absolute reliance on exclusionary practices for religious, ethical or social reasons. Here too, the upgrade reflects changes that occurred during 2018 in the profile of the sustainable taxable fixed income universe of mutual funds due to the expansion in the number of funds offered in this market segment by mainstream investment management firms and the expansion in the universe of available like funds.
The SUSTAIN Fixed Income Index now consists of the ten largest qualifying funds, including the following mutual funds/share classes that have been added as of December 31, 2018: Morgan Stanley Institutional Core Plus Fixed Income Institutional Shares, Touchstone Impact Bond Institutional, Aberdeen Total Return Bond I, Parnassus Fixed Income and Domini Impact Bond Investor. Refer to Table 2.
After a strong December, the SUSTAIN Bond Fund Index posted an increase of 1.2% in January, exceeding the Bloomberg Barclays US Aggregate Index by 15 basis points. Positive contributions to the outperformance of the index were made by six funds that achieved excess index returns, led by the 1.77% posted by the Morgan Stanley Institutional Core Plus Fixed Income Institutional Fund. The fund, which maintained an average BB credit quality, benefited from its above index allocation of 25.17% to non-investment grade or non-rated bonds as high yield bonds eclipsed investment-grade bonds by over 4X. This level compares a limited 2.63% exposure to such securities and an average single A credit quality position maintained by the lowest performing Touchstone Impact Bond Institutional Fund that recorded a gain of 0.75% in January.
The SUSTAIN Bond Fund Index, when combined with Indicator values through year-end 2018, is up 3.19% for the trailing 3-months and 2.17% for the trailing one-year. Refer to Chart 2.
For SUSTAIN Equity and Bond Fund Index explanations, refer to article entitled Sustainable (SUSTAIN) Equity and Bond Fund Indexes Explained.
Sustainableinvest.com
Benefits
Free access to regularly updated original research and analysis focused exclusively on sustainable finance and investing, providing investors with the guidance needed to make informed investment decisions that align with their personal values and financial goals while also contributing to the advancement of positive long-term environmental and social outcomes.
By offering financial support for our current work, either in the form of a one-time or regular contributions, you help to defray some of the costs associated with conducting our research and analysis as well as to maintain the www.sustainablest.wpengine.com website.
Helping us to expand our research capabilities and offerings over time to cover additional relevant topics geared to sustainable investors.
Sign up to free newsletters.
By submitting this form, you are consenting to receive marketing emails from: . You can revoke your consent to receive emails at any time by using the SafeUnsubscribe® link, found at the bottom of every email. Emails are serviced by Constant Contact