The Bottom Line: Conventional passively managed equity and fixed income ETFs are subject to lower expense ratios but attractively priced sustainable ETFs are still available.
The first in a series of updated articles focused on the expense ratios of sustainable mutual funds and ETFs: Index-tracking equity and fixed income ETFs
This is the first in a series of updated articles focusing on the expense ratios of mutual funds and ETFs, starting with an analysis covering sustainable index tracking equity and fixed income ETFs. Sustainable Research and Analysis LLC analyzed one of the costs associated with investing in sustainable exchange traded funds, namely fund expense ratios. Fund operating expenses, expressed as an expense ratio, typically represent the largest cost incurred by ETF investors, generally exceeding costs linked to bid/asked spreads[1], trading and tracking error[2]. Some of these costs are not quantified.
Overall Findings: Based on an evaluation of asset weighted expense ratios, conventional passively managed equity and fixed income ETFs charge lower operating expenses than sustainable counterparts
With an emphasis on asset weighted expense ratios, conventional passively managed equity and fixed income ETFs charge lower expenses than their sustainable fund counterparts. That said, the differentials are not significant, ranging from a low of 3 bps to a high of 32 bps (excluding municipal ETFs as there is only one sustainable municipal passively managed ETF). While the number of options remain small relative to conventional ETFs, the range of expense ratios is narrower and investors have access to attractively priced ETF options.
Equity Index ETFs
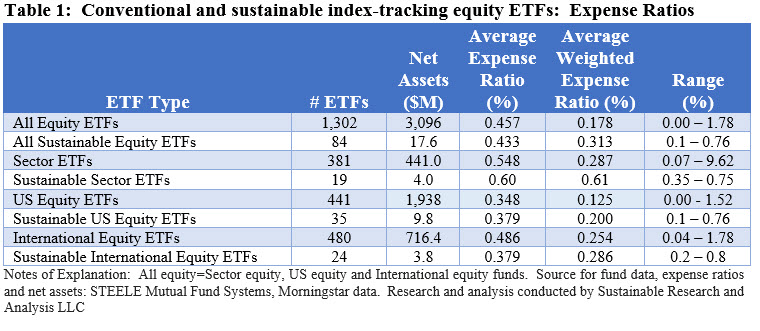
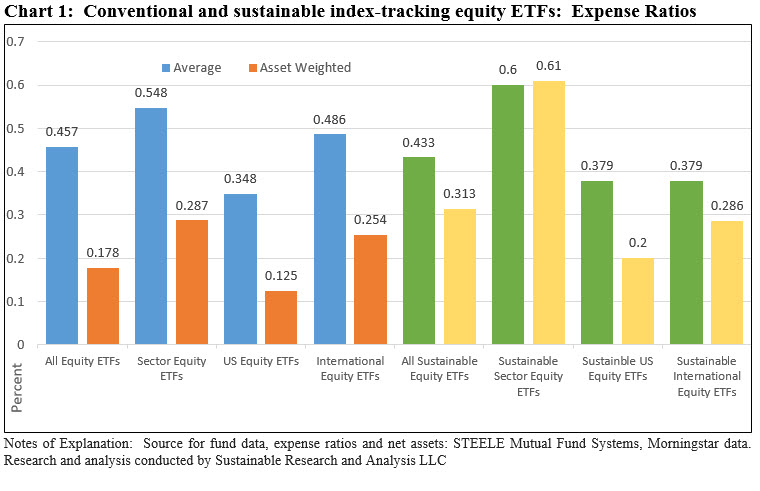
The broader conventional universe of passively managed equity ETFs, consisting of 1,302 US equity, sector equity and international equity funds in operation as of September 30, 2019 with $3.1 trillion in assets, dwarfs the 84 index-tracking sustainable ETFs with $17.6 billion invested in the equivalent fund categories. Across this universe of funds, the overall average expense ratio of sustainable passively managed equity funds is lower than the broader conventional universe of ETFs by a full 24 basis points. Refer to Table 1 and Chart 1. However, this is not the case when expense ratios are evaluated on an asset weighted basis—meaning when expense ratios are qualified relative to the corresponding size of funds. The asset weighted expense ratio for the conventional universe of index-tracking ETFs is 0.18% versus 0.31% for their sustainable equity ETF counterparts. That is to say, the asset weighted expense ratio of sustainable ETFs is 13 basis points higher as larger-sized conventional funds are subject to lower expense ratios.
For both sustainable and conventional ETFs, expense ratios vary across the three investment categories that make up the equity funds universe. Sector funds levy the highest fees, followed by international funds and US equity funds. Conventional index tracking funds are offered at lower expense ratios across the three equity categories when calculated on an asset weighted basis and in two of the three categories based on simple averages.
That said, the expense ratios of sustainable index tracking ETFs all fall within a narrower range relative to their conventional counterparts and investors have the opportunity to take advantage of sustainable equity ETFs offered at the lower end of the expense ratio range. At the same time, investors attracted to investment themes such as clean water and clean energy that are subject to operating expenses that are as high as 75 bps, have to evaluate the trade-offs.


Fixed Income Index ETFs
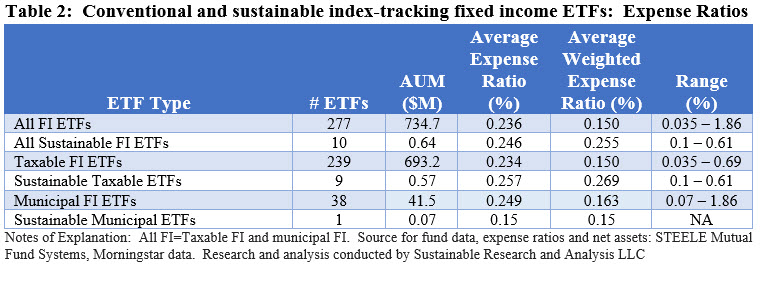
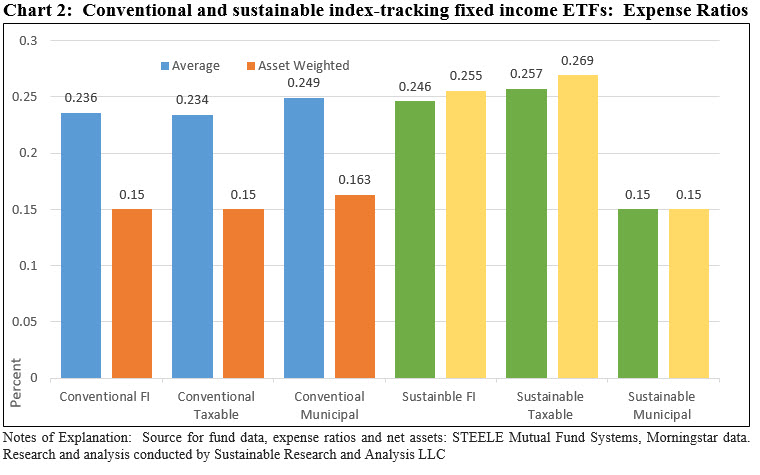
While the number of sustainable fixed income ETFs has been expanding, these are still limited. At the end of September 2019, the number stood at 10 funds, including nine taxable funds and one municipal bond fund with $640 billion in assets under management. The average expense ratio of this small universe of funds is 10 basis points higher than the average expense ratio of 277 index-oriented conventional passively managed fixed income funds. On an asset weighted basis, a 10 bps differential also applies. At the same time, the expense ratios of sustainable funds fall within a narrower range, extending between 0.1% to a high of 0.61% versus the entire universe of fixed income ETFs with an expense ratio range from 0.035% to 1.86%. Refer to Table 2 and Chart 2.
Due to the small universe of sustainable fixed income ETFs, the average and asset weighted results are skewed by the higher than average expense ratio of the $128.3 million faith-based impact oriented Inspire Corporate Bond Impact ETF that is subject to a 0.61% expense ratio. Excluding this fund reduces the average expense ratio to 0.206%, or 30 bps below conventional ETFs, and narrows the asset weighted expense ratio relative to conventional funds to within 2 bps.


[1] During the market’s coronavirus rout during the two weeks to March 27, 2020 it was reported that some fixed income ETFs traded at historic discounts to NAV that exceeded fund operating expenses.
[2] This is not the case for ETFs that have recently dropped to 0% expense ratios on selected funds.


