The Bottom Line: Uncertainties chipped away at August’s stock market 7.01% gain with a -3.80% decline in September while ESG indices across the board outperformed.
Uncertainties chipped away at August’s 7.01% gain with a -3.80% decline in September
Reversing course after August’s 7.01% gain, stocks turned negative in September due to growing concerns about the higher COVID-19 infection rates and a pullback in openings, re-closings and restrictions that were threatening the economic recovery. With some signs of economic weakness in evidence and uncertainties surrounding the upcoming presidential election coming into focus, the S&P 500 posted a decline of -3.80%. Still, the broad-based index remained in positive territory for the quarter and year-to-date intervals with gains of 8.93% and 5.57%, respectively. Small cap stocks turned in slightly better results based on the Russell 2000, giving up -3.34% while also maintaining a positive third quarter outcome with an increase of 4.93%. Year-to-date results, however, lag by a wider margin as the Russell 2000 Index was down -8.69%[1]. Whereas large cap value stocks outperformed growth stocks in September, this was not the case for midcap and small cap stocks. Value-oriented stocks across the market capitalization range continue to trail significantly on a year-to-date basis with returns ranging from -11.5% for large caps and -22.9% for small cap stocks. Across sectors, all but the Materials and Utilities sectors landed in positive territory whereas the steepest declines were sustained by large cap energy stocks that registered a decline of -14.5% and the Information Technology sector that gave up -5.4%. The Nasdaq Composite was not far behind, dropping -5.1% while still rewarding investors with quarterly and year-to-date gains of 11.2% and 25.3%, in that order.
Global and international markets also posted negative results in September
With limited exceptions, global and international equity markets also posted negative results in September. The MSCI[2] ACWI ex USA Index registered a decline of -2.4% while the MSCI EAFE Index and the MSCI Emerging Markets Index gave up -2.6% and -1.6%. A number of developed and developing national market indices posted positive results, including Korea, Taiwan, Mexico, Japan, and India, that turned in total returns of 3.1%, 2.1%, 1.1%, 1.1%, 0.6%, respectively. While China registered a decline of -2.7% in September, the market was up 12.6% in the third quarter and 16.6% year-to-date. That’s the best year-to-date return across global and international markets, in contrast to the worst performing Latin America region that reflects a -35.9% decline over the same interval.
Treasuries aside, U.S. and global bond markets end lower
The Bloomberg Barclays U.S. Aggregate Bond Index posted its second consecutive negative return in September, falling 5 basis points. Treasuries across the board returned 0.14% while longer-dated Treasuries were higher for the month, outperforming MBS, -0.11%, corporates, -0.29%, and high yield bonds, -1.0%. The FTSE World Government (unhedged) Index ended lower at -0.2%.
ESG indices outperformed in September
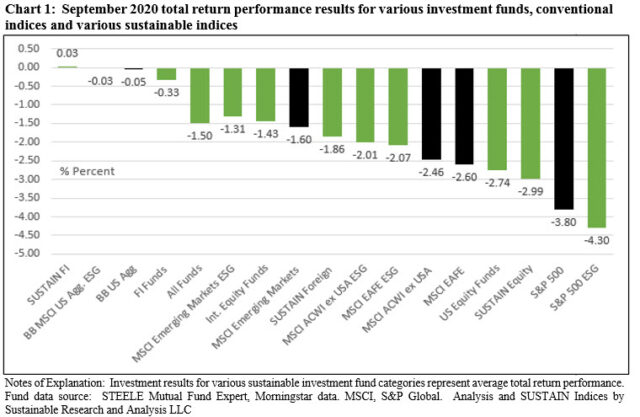
The universe of 4,722 sustainable[3] mutual funds/share classes and ETFs across various fund categories with $2,814.5 billion in assets recorded an average -1.50% total return in September. At the same time, each of the three sustainable fund indices tracked by Sustainable Research and Analysis outperformed their conventional benchmarks by a range extending from 9 bps achieved by the SUSTAIN Fixed Income Fund Index to 2.44% recorded by the SUSTAIN Foreign Fund Index.
The S&P 500 ESG Index, recently updated to exclude thermal coal companies, declined by -4.3%, for a negative variance relative to the S&P 500 of 50 basis points. The ESG index continues to outpace the conventional index, however, in Q3 and over the year-to-date and trailing 12-month interval. Likely attributable to sector variations, holdings and company specific index weightings, the opposite results were registered by the MSCI USA ESG Leaders Index, down -3.45% in September as compared to -3.73% posted by the MSCI USA Index, for a positive differential of 28 bps. Similarly, MSCI global and international ESG Leaders indices, including the ACWI ex USA Leaders Index, EAFE ESG Leaders Index and Emerging Markets ESG Leaders Index each outpaced their conventional counterparts by margins ranging from 29 bps to 53 bps. Excepting the US, the outperformance of the ESG Leaders indices applies to the third quarter, year-to-date and trailing 12-month intervals. As for fixed income, the Bloomberg Barclays MSCI Aggregate ESG Index exceeded the performance of its conventional counterpart by 2 bps. Refer to Chart 1.

Sustainable (SUSTAIN) Large Cap Equity Fund Index beat the S&P 500 in September by a wide 81 bps
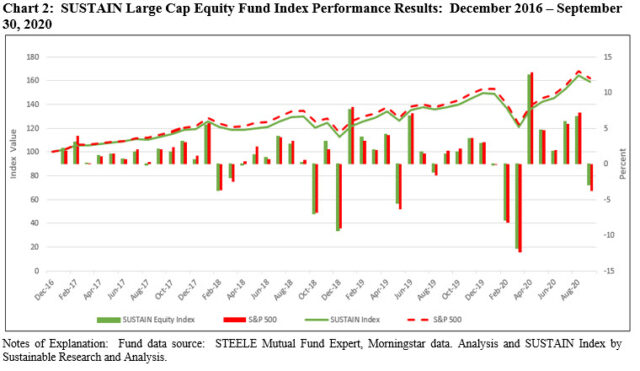
The Sustainable (SUSTAIN) Large Cap Equity Fund Index registered a -2.99% decline in August and exceeded the performance of the S&P 500 Index by 81 bps. The SUSTAIN index was powered by the better than conventional index performance recorded by eight of the ten funds that comprise the index, led by the Hartford Capital Appreciation Fund A, down -1.37%. The same fund was the second best performer in Q3, registering a 10.67% gain. At the other end of the range in September, the JPMorgan US Equity Fund R6 and the Schroder North American Equity Fund Investor class both posted -4.19% total returns. Each of the three funds integrate ESG into investment decisions.
This was the first negative result for the SUSTAIN Index as well as the S&P 500 after posting five successive monthly positive outcomes. The 81 bps margin of outperformance was also the widest so far this year and in fact, the widest since November 2018. This, in turn, narrowed the negative variance of 2.52% between the SUSTAIN Index relative to the S&P 500 since the inception date as of December 31, 2016. Refer to Chart 2.
The SUSTAIN Large Cap Equity Fund Index also outperformed the S&P 500 Index over the third quarter, year-to-date and trailing 12-month intervals.

Sustainable (SUSTAIN) Bond Fund Index reversed course, recording a positive 0.03% total return that eclipsed the conventional yardstick by 9 bps
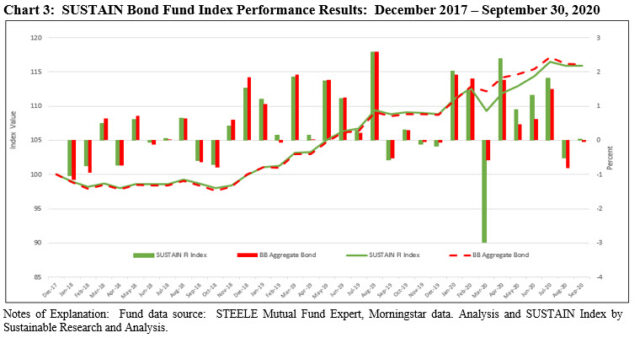
The Sustainable (SUSTAIN) Bond Fund Index reversed course and posted a positive 0.32% return in September after giving up -0.5% in August, exceeding by 9 bps the performance of the Bloomberg Barclays US Aggregate Bond Index that was down -0.05%. All but three SUSTAIN Index fund constituents recorded positive to zero rates of return, led by a gain of 0.19% achieved by the JPMorgan Core Bond Fund R6. On the other hand, the BMO Core Plus Bond Fund I dropped 0.17% and landed in last place among the ten component funds. Both funds integrate ESG factors.
The SUSTAIN Bond Fund Index is now beating the Bloomberg Barclays index for the sixth consecutive month. This also puts the index ahead in the third quarter, but leaves it trailing on a year-to-date, 12-month and since inception basis to December 31, 2017. Refer to Chart 3.

The Sustainable (SUSTAIN) Foreign Fund Index declined -1.86% and outperformed the MSCI ACWI ex USA Index by a wide 2.44%
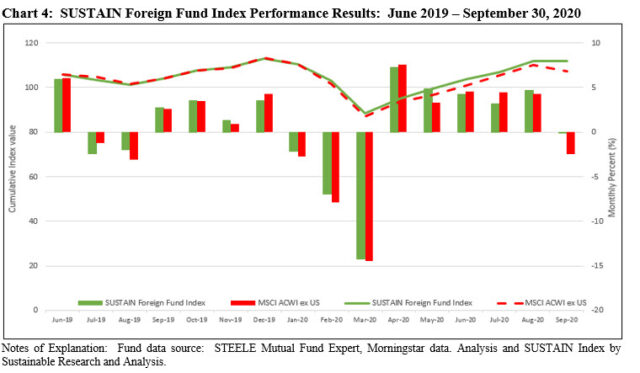
The Sustainable (SUSTAIN) Foreign Fund Index dropped -1.86% in September versus a decline of -2.46% recorded by the MSCI ACWI ex USA, for a positive differential of 2.44%. This was the widest level of outperformance since the inception of the SUSTAIN Foreign Fund Index as of December 2017. Eight of ten index members outperformed, led by the Aberdeen Select International Equity Fund A, down -1.14%. The same fund led in the third quarter with a gain of 10.84%. At the other end of the range, BMO Pyrford International Stock Fund I recorded a drop of -3.16% and led the rear with its 2.8% gain for the quarter. Both funds also integrate ESG factors.
The SUSTAIN Foreign Fund Index remains ahead of the MSCI ACWI ex USA Index since inception as well as the year-to-date and trailing 12-month periods. Refer to Chart 4.

[1] There is a wide divergence in the Y-T-D results of the S&P 600, -15.3%, versus the Russell 2000 that has declined by -8.69%.
[2] All MSCI index results are net of any applicable taxes.
[3] While definitions continue to evolve, sustainable investing refers to a range of five overarching investing approaches or strategies that encompass: values-based investing, negative screening (exclusions), thematic and impact investing and ESG integration. Shareholder and bondholder engagement and proxy voting may also be employed along with one of more of these strategies that are not mutually exclusive.
ESG indices outperformed in September
The Bottom Line: Uncertainties chipped away at August’s stock market 7.01% gain with a -3.80% decline in September while ESG indices across the board outperformed.
Share This Article:
The Bottom Line: Uncertainties chipped away at August’s stock market 7.01% gain with a -3.80% decline in September while ESG indices across the board outperformed.
Uncertainties chipped away at August’s 7.01% gain with a -3.80% decline in September
Reversing course after August’s 7.01% gain, stocks turned negative in September due to growing concerns about the higher COVID-19 infection rates and a pullback in openings, re-closings and restrictions that were threatening the economic recovery. With some signs of economic weakness in evidence and uncertainties surrounding the upcoming presidential election coming into focus, the S&P 500 posted a decline of -3.80%. Still, the broad-based index remained in positive territory for the quarter and year-to-date intervals with gains of 8.93% and 5.57%, respectively. Small cap stocks turned in slightly better results based on the Russell 2000, giving up -3.34% while also maintaining a positive third quarter outcome with an increase of 4.93%. Year-to-date results, however, lag by a wider margin as the Russell 2000 Index was down -8.69%[1]. Whereas large cap value stocks outperformed growth stocks in September, this was not the case for midcap and small cap stocks. Value-oriented stocks across the market capitalization range continue to trail significantly on a year-to-date basis with returns ranging from -11.5% for large caps and -22.9% for small cap stocks. Across sectors, all but the Materials and Utilities sectors landed in positive territory whereas the steepest declines were sustained by large cap energy stocks that registered a decline of -14.5% and the Information Technology sector that gave up -5.4%. The Nasdaq Composite was not far behind, dropping -5.1% while still rewarding investors with quarterly and year-to-date gains of 11.2% and 25.3%, in that order.
Global and international markets also posted negative results in September
With limited exceptions, global and international equity markets also posted negative results in September. The MSCI[2] ACWI ex USA Index registered a decline of -2.4% while the MSCI EAFE Index and the MSCI Emerging Markets Index gave up -2.6% and -1.6%. A number of developed and developing national market indices posted positive results, including Korea, Taiwan, Mexico, Japan, and India, that turned in total returns of 3.1%, 2.1%, 1.1%, 1.1%, 0.6%, respectively. While China registered a decline of -2.7% in September, the market was up 12.6% in the third quarter and 16.6% year-to-date. That’s the best year-to-date return across global and international markets, in contrast to the worst performing Latin America region that reflects a -35.9% decline over the same interval.
Treasuries aside, U.S. and global bond markets end lower
The Bloomberg Barclays U.S. Aggregate Bond Index posted its second consecutive negative return in September, falling 5 basis points. Treasuries across the board returned 0.14% while longer-dated Treasuries were higher for the month, outperforming MBS, -0.11%, corporates, -0.29%, and high yield bonds, -1.0%. The FTSE World Government (unhedged) Index ended lower at -0.2%.
ESG indices outperformed in September
The universe of 4,722 sustainable[3] mutual funds/share classes and ETFs across various fund categories with $2,814.5 billion in assets recorded an average -1.50% total return in September. At the same time, each of the three sustainable fund indices tracked by Sustainable Research and Analysis outperformed their conventional benchmarks by a range extending from 9 bps achieved by the SUSTAIN Fixed Income Fund Index to 2.44% recorded by the SUSTAIN Foreign Fund Index.
The S&P 500 ESG Index, recently updated to exclude thermal coal companies, declined by -4.3%, for a negative variance relative to the S&P 500 of 50 basis points. The ESG index continues to outpace the conventional index, however, in Q3 and over the year-to-date and trailing 12-month interval. Likely attributable to sector variations, holdings and company specific index weightings, the opposite results were registered by the MSCI USA ESG Leaders Index, down -3.45% in September as compared to -3.73% posted by the MSCI USA Index, for a positive differential of 28 bps. Similarly, MSCI global and international ESG Leaders indices, including the ACWI ex USA Leaders Index, EAFE ESG Leaders Index and Emerging Markets ESG Leaders Index each outpaced their conventional counterparts by margins ranging from 29 bps to 53 bps. Excepting the US, the outperformance of the ESG Leaders indices applies to the third quarter, year-to-date and trailing 12-month intervals. As for fixed income, the Bloomberg Barclays MSCI Aggregate ESG Index exceeded the performance of its conventional counterpart by 2 bps. Refer to Chart 1.
Sustainable (SUSTAIN) Large Cap Equity Fund Index beat the S&P 500 in September by a wide 81 bps
The Sustainable (SUSTAIN) Large Cap Equity Fund Index registered a -2.99% decline in August and exceeded the performance of the S&P 500 Index by 81 bps. The SUSTAIN index was powered by the better than conventional index performance recorded by eight of the ten funds that comprise the index, led by the Hartford Capital Appreciation Fund A, down -1.37%. The same fund was the second best performer in Q3, registering a 10.67% gain. At the other end of the range in September, the JPMorgan US Equity Fund R6 and the Schroder North American Equity Fund Investor class both posted -4.19% total returns. Each of the three funds integrate ESG into investment decisions.
This was the first negative result for the SUSTAIN Index as well as the S&P 500 after posting five successive monthly positive outcomes. The 81 bps margin of outperformance was also the widest so far this year and in fact, the widest since November 2018. This, in turn, narrowed the negative variance of 2.52% between the SUSTAIN Index relative to the S&P 500 since the inception date as of December 31, 2016. Refer to Chart 2.
The SUSTAIN Large Cap Equity Fund Index also outperformed the S&P 500 Index over the third quarter, year-to-date and trailing 12-month intervals.
Sustainable (SUSTAIN) Bond Fund Index reversed course, recording a positive 0.03% total return that eclipsed the conventional yardstick by 9 bps
The Sustainable (SUSTAIN) Bond Fund Index reversed course and posted a positive 0.32% return in September after giving up -0.5% in August, exceeding by 9 bps the performance of the Bloomberg Barclays US Aggregate Bond Index that was down -0.05%. All but three SUSTAIN Index fund constituents recorded positive to zero rates of return, led by a gain of 0.19% achieved by the JPMorgan Core Bond Fund R6. On the other hand, the BMO Core Plus Bond Fund I dropped 0.17% and landed in last place among the ten component funds. Both funds integrate ESG factors.
The SUSTAIN Bond Fund Index is now beating the Bloomberg Barclays index for the sixth consecutive month. This also puts the index ahead in the third quarter, but leaves it trailing on a year-to-date, 12-month and since inception basis to December 31, 2017. Refer to Chart 3.
The Sustainable (SUSTAIN) Foreign Fund Index declined -1.86% and outperformed the MSCI ACWI ex USA Index by a wide 2.44%
The Sustainable (SUSTAIN) Foreign Fund Index dropped -1.86% in September versus a decline of -2.46% recorded by the MSCI ACWI ex USA, for a positive differential of 2.44%. This was the widest level of outperformance since the inception of the SUSTAIN Foreign Fund Index as of December 2017. Eight of ten index members outperformed, led by the Aberdeen Select International Equity Fund A, down -1.14%. The same fund led in the third quarter with a gain of 10.84%. At the other end of the range, BMO Pyrford International Stock Fund I recorded a drop of -3.16% and led the rear with its 2.8% gain for the quarter. Both funds also integrate ESG factors.
The SUSTAIN Foreign Fund Index remains ahead of the MSCI ACWI ex USA Index since inception as well as the year-to-date and trailing 12-month periods. Refer to Chart 4.
[1] There is a wide divergence in the Y-T-D results of the S&P 600, -15.3%, versus the Russell 2000 that has declined by -8.69%.
[2] All MSCI index results are net of any applicable taxes.
[3] While definitions continue to evolve, sustainable investing refers to a range of five overarching investing approaches or strategies that encompass: values-based investing, negative screening (exclusions), thematic and impact investing and ESG integration. Shareholder and bondholder engagement and proxy voting may also be employed along with one of more of these strategies that are not mutually exclusive.
Sustainableinvest.com
Benefits
Free access to regularly updated original research and analysis focused exclusively on sustainable finance and investing, providing investors with the guidance needed to make informed investment decisions that align with their personal values and financial goals while also contributing to the advancement of positive long-term environmental and social outcomes.
By offering financial support for our current work, either in the form of a one-time or regular contributions, you help to defray some of the costs associated with conducting our research and analysis as well as to maintain the www.sustainablest.wpengine.com website.
Helping us to expand our research capabilities and offerings over time to cover additional relevant topics geared to sustainable investors.
Sign up to free newsletters.
By submitting this form, you are consenting to receive marketing emails from: . You can revoke your consent to receive emails at any time by using the SafeUnsubscribe® link, found at the bottom of every email. Emails are serviced by Constant Contact