Both stocks and bonds tumble in April 2022
Concerns and uncertainties ranging from the Russia-Ukraine conflict, inflation, interest rates, continued labor shortages, supply chain issues, COVID lockdowns in China, corporate earnings and economic growth prospects produced the worst month so far this year for both equities and bonds. The same uncertainties are expected to remain largely unresolved in May. The S&P 500 dropped…
Share This Article:
The Bottom Line: Stocks and bonds experienced the worst month so far this year while the relative performance of sustainable equity and bond indices improve.
Stocks and bonds suffer through the worst month so far this year
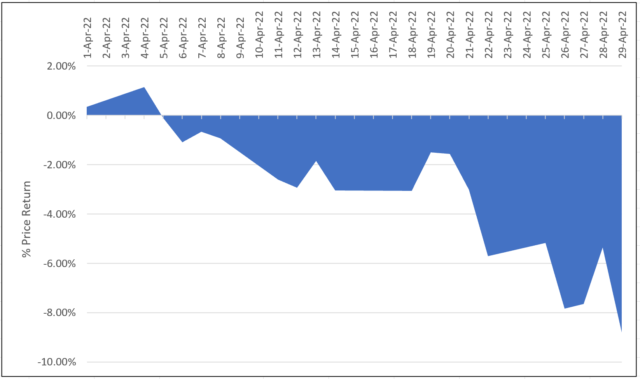
Concerns and uncertainties ranging from the Russia-Ukraine conflict, inflation, interest rates, continued labor shortages, supply chain issues, COVID lockdowns in China, corporate earnings and economic growth prospects produced the worst month so far this year for both equities and bonds. The same uncertainties are expected to remain largely unresolved in May. The S&P 500 dropped 8.72% as all sectors but Consumer Staples posted negative results, including Energy, while bonds gave up 3.79%. The NASDAQ Composite posted a -13.2% decline and the Dow Jones Industrial Average recorded a drop of 4.8%. Value outperformed growth stocks across the market capitalization range and large cap stocks overshadowed small caps. Except for the first two trading days of the month, the stock market, as measured by the S&P 500, experienced volatility and a sustained downtrend, recording 12 negative trading days of 20, with seven trading days posting declines in excess of 1%. On the last day of the month the decline was 3.63% on a price basis. Refer to Chart 1.
Except for emerging markets in Eastern Europe and Latin America that recorded declines of -15.47% and 12.31%, respectively, foreign stocks bested their US counterparts. The MSCI Emerging Markets Index, MSCI ACWI, ex US Index and MSCI EAFE Index were down 5.56%, 6.28% and 6.47%, in that order.
US and global bonds delivered the worst results in four months against a backdrop of rising yields, dropping 3.79% and 5.48%, according to the Bloomberg US Aggregate Bond Index and Bloomberg Global Aggregate Bond Index. The 10-year Treasury yield gained 54 bps in April while 3-month Treasury yields added 33 bps. Longer dated corporate bonds posted almost double-digit declines.
Chart 1: S&P 500 cumulative price performance-April 2022
Source: Yahoo finance/S&P Globa
Sustainable mutual funds and ETFs recorded an average 6.92% decline in April
Sustainable mutual funds and ETFs, a combined total of 1,299 funds, recorded an average 6.92% decline in April and a drop of 8.49% over the trailing 12-months. Only 33 funds, or 3%, registered one-month results greater than 0.0%. The top performing sustainable funds in April were all prime money market funds, except for the AQR Sustainable Long-Short Equity Carbon Awareness Fund, N, I and R6 share classes that were up between 2.77% and 2.87%. The top performing sustainable money funds were all prime funds that generated returns ranging from 3 pbs to 5 bps. At the other end of the range, the worst performers consisted of thematic funds focused on clean and alternative energy. Results ranged from -17.8% to -31.52%. Refer to Tables 1a and 1b.
Table 1a: Top 10 performing funds Table 1b: Bottom 10 performing funds
Fund Name
April TR (%)
12-M TR (%)
Fund Name
April TR (%)
12-M
TR (%)
AQR Sustainable Long-Short Eq Cbn Awr N
2.87
Cushing® Global Clean Equity I
-17.8
-31.68
AQR Sustainable Long-Short Eq Cbn Awr I
2.86
ETRACS 2x Lgd MSCI US ESG Fcs TR ETN
-18.19
AQR Sustainable Long-Short Eq Cbn Awr R6
2.77
Firsthand Alternative Energy
-18.24
-22.14
Morgan Stanley Inst Lqdty ESG MMkt CslOk
0.05
ProShares S&P Kensho Cleantech ETF
-18.77
State Street ESG Liquid Reserves Pre
0.04
0.08
Global X Hydrogen ETF
-19.02
UBS Select ESG Prime Institutional
0.04
0.03
First Trust NASDAQ® Cln Edge® GrnEngyETF
-19.18
-19.4
Morgan Stanley Inst Lqdty ESG MMkt Inst
0.04
0.05
ALPS Clean Energy ETF
-20.71
-30.6
BlackRock Liquid Environmntlly Awr Drt
0.04
0
Invesco WilderHill Clean Energy ETF
-21.7
-40.87
State Street ESG Liquid Reserves Cb Cptl
0.03
Direxion Dl Glbl Clean Ey Bull 2X Shrs
-23.97
State Street ESG Liquid Reserves Opp
0.03
Viridi Cleaner Engy Crypto Mng & Sem ETF
-31.52
Notes of Explanation: Performance covering both mutual funds and ETFs=total returns in percentage terms for periods ending April 29, 2022. 1-M=1 month, 12-M=12 months. Blank cells=fund was not in operation during entire interval. Source: Morningstar Direct.
Relative performance of sustainable equity and bond indices show improvement for second month
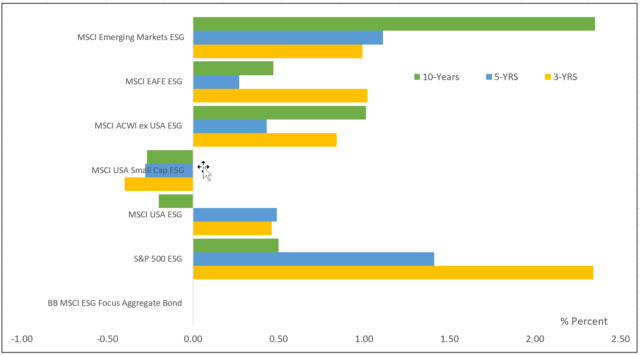
Showing improvement in their relative performance for the second month, the total return results achieved by selected sustainable equity and bond indices placed well relative to their conventional counterparts. Four of six selected ESG benchmarks (five Leaders and one Focus index) maintained by MSCI beat their non-ESG counterparts. This applies to selected ESG Leaders indices that provide exposure to companies with high ESG performance relative to sector peers.
With the exception of the MSCI USA Small Cap ESG Leaders Index and the 10-year record posted by the MSCI USA ESG Leaders Index, the intermediate and long-term track records of sustainable bond and stock benchmarks continue to outperform. Refer to Chart 2.
Chart 2: Selected sustainable indices intermediate and long-term relative total return performance results to April 29, 2022
Notes of Explanation: MSCI equity indices are the ESG Leaders indices while fixed income is ESG Focus. Blanks indicate performance results are not available. Intermediate and long-term results include 3-5-and 10-year returns that are expressed as average annual returns. MSCI USA Small Cap returns are price only. Sources: MSCI, S&P Global, Sustainable Research and Analysis LLC
SRA Select List of funds posted an average decline of -5.54% in April
Based on an equal weighting basis, SRA Select funds posted an average decline of -5.54% in April versus an average -5.72% registered by the average performance of corresponding conventional benchmarks². Excluding money market funds, returns ranged from -3.621% posted by the iShares USD Green Bond ETF (BGRN) to a low of -8.64% registered by the iShares ESG Aware MSCI USA Small-Cap ETF (ESML). Refer to Table 2 for a complete rundown of SRA Select list of mutual funds and ETFs and their April performance results.
Consisting of nine funds³ pursuing discrete investment strategies intend for use as building blocks in the creation of a diversified ESG-oriented portfolio, only two of the nine funds outperformed their conventional benchmarks in April (Refer to previously published article SRA Select Listing: ESG Integration Investment Fund Q1-2022 https://sustainablest.wpengine.com/sra-select-listing-esg-integration-investment-funds-q1-2022/
Table 2: Performance of SRA Select listed mutual funds and ETFs-April 2022
Fund name/Index
Expense Ratio (%)
Assets ($ millions)
1-Month Total Return (%)
3-Month Total Return (%)
12-Month Total Return (%)
3-Year Average TR (%)
iShares ESG Advanced Hi Yld Corp Bd ETF (HYXF)
0.35
169.6
-3.85
-6.08
-6.65
1.77
iShares ESG Aware MSCI EAFE ETF (ESGD)
0.2
7086.5
-6.21
-9.6
-9.11
4.65
iShares ESG Aware MSCI USA Small-Cap ETF (ESML)
0.17
1471.4
-8.64
-6.45
-12.11
9.64
iShares ESG U.S. Aggregate Bond ETF (EAGG)
0.1
1908.6
-3.78
-7.48
-8.59
0.31
iShares MSCI ACWI Low Carbon Target ETF (CRBN)
0.2
1082.4
-8.09
-9.18
-5.96
9.69
iShares MSCI KLD 400 Social ETF (DSI)
0.25
3613.7
-9.12
-9.3
-0.95
14.25
iShares USD Green Bond ETF (BGRN)
0.2
245.1
-3.61
-8.45
-9.83
-0.65
iShares® ESG MSCI EM Leaders ETF (LDEM)
0.16
65.5
-6.54
-13.73
-19.8
BlackRock Liquid Environmentally Awr Inv A (LEAXX)
0.45
0.3
0.01
-0.02
-0.05
0.54
Vanguard Treasury Money Market Fund Investor (VUSXX)
0.09
34,496.4
0.03
0.04
0.05
0.63
Average*
0.23
1,738.12
-5.54
-7.81
-8.12
5.03
S&P 500 Index
-8.72
-8.17
0.21
13.85
MSCI USA Index
-9.07
-8.33
-1.6
13.86
MSCI USA Small Cap Index
-8.42
-6.57
-13.0
7.65
MSCI EAFE Index
-6.47
-7.53
-8.15
4.44
MSCI ACWI Index
-8.0
-8.44
-5.44
9.41
MSCI Emerging Markets Index
-5.56
-10.45
-18.33
2.24
Bloomberg U.S. Treasury Bill (1-3 M)
0.02
0.05
0.08
0.68
Bloomberg U.S. Aggregate Bond Index
-3.79
-7.51
-8.51
0.38
Bloomberg Corporate High Yield Index
-3.56
-5.64
-5.22
2.84
ICE BofML Green Bond Hedged US Index
-3.60
-8.29
-9.49
-0.28
Average Returns**
-5.72
-7.09
-6.95
5.51
Notes of Explanation: $AUM in millions. Blank cells=fund was not in operation during entire interval. *Average returns exclude the Vanguard Treasury Money Market Fund Investor. **Average returns exclude the S&P 500 Index. Source: Morningstar Direct.
² To avoid duplications, these results exclude Vanguard Treasury Money Market Fund and S&P 500.
³ A tenth fund, the Vanguard Treasury Money Market Fund, is an alternative money market fund.
Sustainableinvest.com
Benefits
Free access to regularly updated original research and analysis focused exclusively on sustainable finance and investing, providing investors with the guidance needed to make informed investment decisions that align with their personal values and financial goals while also contributing to the advancement of positive long-term environmental and social outcomes.
By offering financial support for our current work, either in the form of a one-time or regular contributions, you help to defray some of the costs associated with conducting our research and analysis as well as to maintain the www.sustainablest.wpengine.com website.
Helping us to expand our research capabilities and offerings over time to cover additional relevant topics geared to sustainable investors.
Sign up to free newsletters.
By submitting this form, you are consenting to receive marketing emails from: . You can revoke your consent to receive emails at any time by using the SafeUnsubscribe® link, found at the bottom of every email. Emails are serviced by Constant Contact