The Bottom Line: Sustainable ETFs/ETNs in 2020 experienced significant growth and ended the year at $93.1 billion across 154 funds. The ESG Integration-Mixed approach dominates.
Sustainable ETFs in 2020 experienced significant growth and ended the year at $93.1 billion in assets
Sustainable ETFs[1], dominated by funds that pursue an ESG Integration-Mixed[2] approach to sustainable investing, experienced dramatic growth in 2020[3]. Total net assets expanded from $33.7 billion at the end of 2019 to $93.1 billion at year-end 2020, an increase of $59.4 billion or 176%. The gains were fueled by positive net cash flows, capital appreciation as well as new sustainable ETF formations that added a net of 37 ETFs during the calendar year, not including a number of ETF re-brandings, to end the year at 154 ETFs and ETNs. Slightly over half of these new funds were launched in the fourth quarter of the year, a record that was also distinguished by the introduction of several esoteric social-themed ETFs. Performance results were very strong across the board in 2020 as sustainable ETFs posted an average gain of 28.3%. Sustainable sector funds, including thematic funds, gained an average 83.8% with alternative energy-oriented funds literally knocking the lights out with returns as high as 233.3%. The top performing thematic funds accounted for 20% of the 2020 net assets gains. Even as increases were realized by both equity funds as well as fixed income ETFs, 83% of the calendar year gain was attributed to equity-oriented investment vehicles. In the process, equity funds now comprise 75% of the category’s assets while bond funds, including both taxable and municipal funds, ended the year with a share of 25% versus 37.6% at the end of 2019[4]. Sustainable passively managed funds or index ETFs expanded their dominance in the segment and ended 2020 with $69.9 billion in net assets. Active ETFs also achieved gains, adding some $10.8 billion in net assets but at the same time these investment vehicles lost market share to index funds and ended year-end 2020 with a 24.9% share of market relative to 36.7% at the end of 2019. The EFT segment is concentrated and dominated by ten firms that account for 92% of assets. These are led by BlackRock’s passively managed iShares and followed by J.P. Morgan’s Asset Management’s largely actively managed ETFs. An analysis of the top 20 sustainable funds that cover $73.9 billion, or 80% of the sustainable segment’s assets under management, indicates that the dominant sustainable investing strategy in the segment is represented by funds that pursue an ESG Integration-Mixed approach.
Sustainable ETFs and ETNs added $59.4 billion in 2020, but gains were concentrated
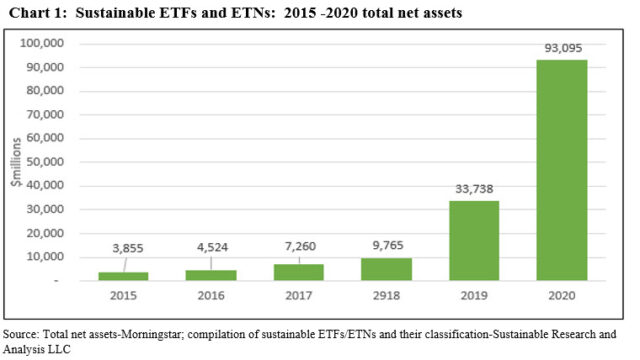
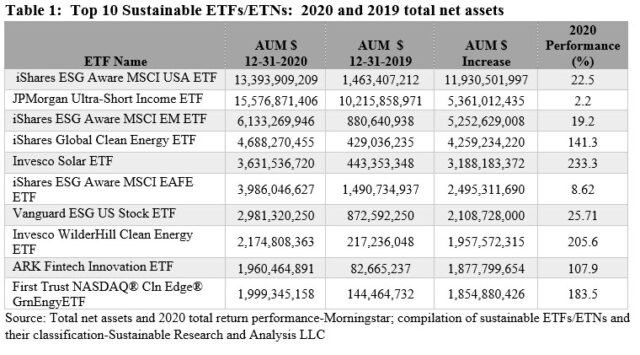
As reflected in Chart 1, sustainable ETF assets growth in 2020 outpaced levels experienced in any of the prior five years as sustainable investing has gained momentum more generally. Sustainable ETF assets added $59.4 billion and closed the year at 154 ETFs and ETNs, benefiting from positive net cash flows, capital appreciation as well as new sustainable ETF formations. Just ten ETFs garnered $40.3 billion or 68% of the net increase in 2020. These funds included four alternative energy-oriented thematic funds that, on a combined basis, attracted a net of $11.3 billion and accounted for 28% of the gain achieved by the top 10 funds.
New sustainable ETF formations achieve new record with 37 fund launches
At year-end, the tally of ETFs launched in 2020 reached 37 new funds and eclipsed last year’s 12 fund launches by over 3X. Slightly over 50% of these, or 19 ETFs, were launched in the fourth-quarter. Q4 also distinguished itself with the introduction of six esoteric values-based socially-oriented ETFs (refer to Fourth quarter 2020 will set new record for sustainable ETFs).
During the year a number of investment management firms introduced first time sustainable ETFs, either in the form of brand new launches or by rebranding existing ETFs or mutual funds. These firms made their debut with a combination of actively managed and index-tracking ETFs. The largest of these firms is Dimensional Fund Advisors (DFA) that launched three core equity ETFs in November and December. These included the actively managed Dimensional US Core Equity Market ETF (DFAU), Dimensional International Core Equity Market ETF (DFAI) and Dimensional Emerging Core Equity Market ETF. In addition, American Century launched two actively managed sustainable ETFs in July. These were on top of funds that were repurposed by several firms, including Wisdom Tree that repurposed three existing ETFs in March. DWS and Invesco also rebranded existing funds. In total, rebranded assets added some $332 million in net assets[5].
At the same time, a total of eight sustainable ETFs were liquidated during 2020, for a closure ratio of 7% relative to the number of ETFs on offer at the end of 2019. While the reasons for fund liquidations can vary, a combination of poor performance, lack of investor interest, or a combination of the two that prevents the fund from achieving break-even due by attracting a minimum level of assets under management. Another reason for fund liquidations is linked to industry mergers and acquisitions that can lead to the consolidation and rationalization in the funds line-up.
Sustainable ETFs and ETNs posted an average gain of 28.3% in 2020
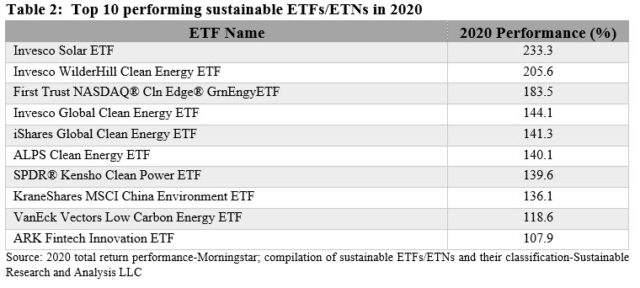
Performance results were very strong across the board in 2020 as ETFs posted an average gain of 28.3%, with total returns ranging from a low of -3.1% recorded by Xtrackers JPMorgan ESG Emerging Market Sovereign ETF, a fund that integrates ESG, to a high of 233.3% registered by Invesco Solar ETF, a thematic-oriented fund.
Ten ETFs recorded gains in excess of 100%. All but one invest in firms focused on alternative energy or in one case, China-based companies that derive at least a majority of their revenues from environmentally beneficial products and services. The one exception is the ARK Fintech Innovation ETF that pursues a financial technology innovation theme. ARK also integrates ESG.
The top four alternative energy-oriented thematic funds that, as noted earlier, attracted $11.3 billion in net assets, produced an average gain of 190.9%, with returns ranging from 141.3% to 233.3%.
Asset allocation: 83% of the calendar year gain was attributed to equity-oriented ETFs
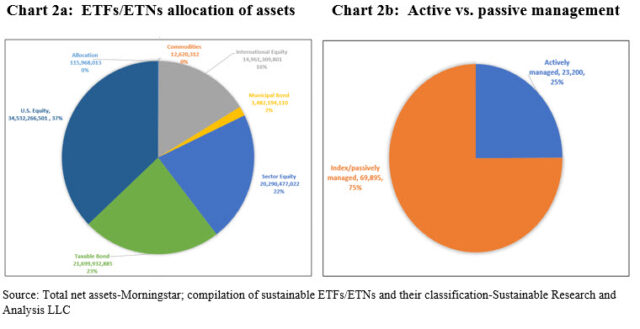
The share of equity ETF net assets expanded to $69.8 billion at the end of year-end 2020 and made up 75% of the segment’s assets which are comprised of US diversified equity funds, sector funds as well as international funds. Fixed income funds, both taxable and municipal funds, stood at $22.8 billion, representing 25% of the segment’s assets. Refer to Chart 2a. The smallest investment category sourcing just $13 million in assets, consists of two ETNs whose objective is to provide exposure to the global price of carbon by tracking an index that references the price of carbon emissions credits from the world’s major emissions related mechanisms, currently including the European Union Emission Trading Scheme and the Kyoto Protocol’s Clean Development Mechanism. The two ETNs turned it strong results in 2010, gaining 33.63% and 31.88%.
Active vs passively managed funds: Passively managed sustainable ETFs expanded their dominance in the segment and sourced $69.9 billion in assets
Passively managed sustainable ETFs expanded their dominance in the segment and sourced $69.9 billion in assets, or 75%, by adding $48.5 billion in 2020. Actively managed ETFs gained new investment funds as well as assets, adding $10.8 billion to end 2020 with $23.2 billion in assets or 25% of the segment’s assets under management. At the same time, actively managed ETFs lost market share which dropped from 36.7% at the end of 2019. The segment, consisting of 42 funds, is dominated by J.P. Morgan that, with its seven actively managed funds and $17.7 billion in assets, accounts for 76.3% of actively managed ETF assets. The next two firms, ARK Financial and Harford, account for a combined total of $3.2 billion in assets with a market share of 14%. Refer to Chart 2b.
Sustainable ETF and ETN segment is concentrated, with top firms accounting for 92% of assets
43 separate organizations are behind the 154 ETFs and ETNs in operation at year-end 2020. The segment is concentrated, however, as ten firms offering 82 ETFs account for $85.9 billion in net assets, or 92% of the assets under management. BlackRock’s iShares leads the pack with its offering of 27 passively managed funds and $40.8 billion in assets that represent a 44% market shares. J.P. Morgan, which largely offers actively managed ETFs but launched the first passively managed fund in December 2020, manages 8 funds with $17.5 billion in assets and a market share of 19%. Invesco, with almost $9 billion in assets, is a distant third with its 10% share of market. Refer to Table 1.
Analysis of top funds based on sustainable investing approach: ESG Integration-Mixed approach dominates
An analysis of the top 20 sustainable funds that on a combined basis cover $73.9 billion, or 80% of the sustainable segment’s assets under management, indicates that the dominant sustainable investing strategy in the segment is represented by funds that pursue an ESG Integration-Mixed approach. A total of nine funds with $38.7 billion in net assets, these funds represent 52% of the top 20 ETFs by assets and 41.5% of all sustainable ETFs at year-end 2020. This group is followed by four funds that employ an ESG Integration approach, sourcing $19.5 billion in assets and accounting for 26% of the top ETF fund assets or 21% of all sustainable ETFs. Thematic funds, consisting of six alternative energy-focused funds at least four of which experienced a blow-out performance year as well as water resources ETFs, ended the year with a total of $14.7 billion in assets and accounted for 20% of the assets attributable to the top 20 funds[6]. The six thematic funds alone gained $12.3 billion in 2020 while the four largest gainers in assets also delivered the beset returns, adding between 153.1% to 233.3% achieved by Invesco Solar. Refer to Table 2.
[1] While definitions continue to evolve, sustainable investing refers to a range of five overarching investing approaches or strategies that encompass: values-based investing, negative screening (exclusions), thematic investing and impact investing and ESG integration. Shareholder/bondholder engagement and proxy voting may also be employed along with one of more of these strategies that are not mutually exclusive.
[2] Explanation ESG Integration. The investment strategy by which environmental, social and governance factors and risks are systematically analyzed and, when deemed relevant and material to an entity’s long-term performance, influence the buy, hold and sell decision of a security. For these reasons, ESG integration is referred to as a value-based investing approach. There are at least three distinct forms of ESG Integration: (1) ESG Integration-Consideration. ESG may be factored into investment decisions, (2) ESG Integration. ESG is accounted for in investment decision making and it may be accompanied by investee engagement and proxy voting, and (3) ESG Integration-Mixed in which ESG Integration is the overarching strategy but additional approaches may also be employed, such as exclusionary investing or impact investing.
[3] Includes four ETNs.
[4] Commodity funds and allocation funds make up less than 1% each.
[5] Net assets of rebranded assets calculated as of month-end following the announcement.
[6] A thematic fund, the ARK Fintech Innovation ETF employs an ESG Integration approach and is classified in that category.


