Summary: Remarks presented at the January 25, 2019 webinar entitled on sustainable investing that covered: (1) 2018 sustainable fund developments, (2) 2019 outlook and (3) conducting sustainable investment managers due diligence.
Note: Presentation slides were made available ahead of the webinar. Relevant slides have been inserted into this document.
Remarks: Good morning and welcome to our sustainable investing webinar at which Steve and I plan to review 2018 sustainable fund developments and our 2019 outlook. In addition, we will discuss the topic of conducting sustainable investment managers due diligence. At the conclusion of our remarks, we will have a Q&A session.
I want to thank you all for joining us yet again after our technical difficulties and I want to offer a special shout out to all my Linked In contacts for being supportive and your kind notes.
Steve and I are with Sustainable Research and Analysis (SRA), an independent firm specializing in sustainable investment funds, their management and distribution. SRA’s goal is to provide financial intermediaries and fund professionals with critical insights and research to support their client’s sustainable investment needs.
So, to begin, I want to make clear that when we refer to sustainable investing, we use it as an umbrella term to capture at least 4 broad sustainable investing strategies. Sustainable investing is the process of allocating capital to companies and other entities with the prospects of achieving a financial return while at the same time attaining a positive societal impact. While the definition has been changing over time, this concept today encapsulates a range of four overarching investment approaches or strategies, although the financial return profiles associated with each of these can vary. Most practitioners agree that these encompass the following approaches:
- Exclusionary (negative screening),
- Thematic and impact investing,
- ESG integration, and
- Shareholder/bond engagement and proxy voting
These approaches or strategies are described in more details in investment research.
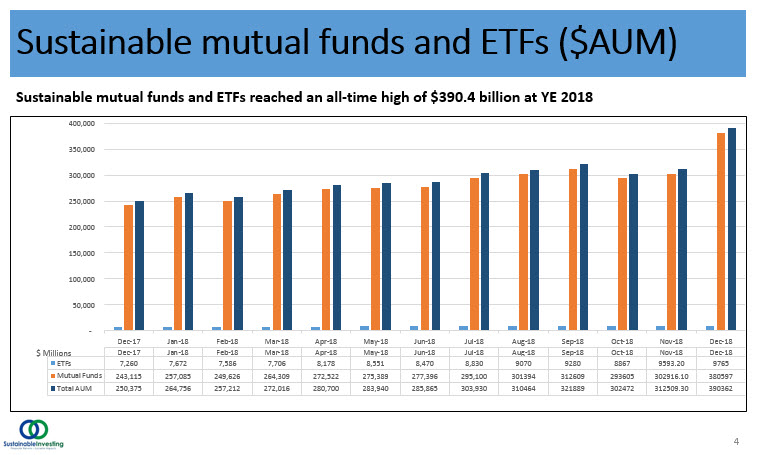
Also, I should note that we are evaluating this segment of the market through the prism of mutual funds and ETFs. In total, there are 89 ETFs and 1,191 mutual funds and share classes with a combined total of $390.4 billion in assets as of year-end 2018. This is a segment of designated mutual funds and ETFs, that, either due to their explicit theme or prospectus language that qualifies these funds based on their sustainable investing mandate.
Mutual Funds and ETFs/ETNs end year 2018 with $390.4 billion in AUM; an estimated $11.45 billion, or 4.6%, is due to net positive inflows while $155.9 billion is due to re-brandings
As many of you may already know, this past year has been a challenging one for the asset management industry, in particular, I am referring to flows and year-end assets under management. Generally, investors continued to pull money out of active funds and placed assets into passive funds. But even more broadly speaking, stand-alone asset management firms or asset management units of banks or other financial institutions, have been reporting declines in revenues and assets under management. BlackRock, for example, reported that assets declined by some $300 billion or 5% year-over-year. Also reporting declines in assets under management were Goldman, Morgan Stanley, JP Morgan Chase, and Charles Schwab.
This stands in contrast to what we found in our research for sustainable funds in 2018. Namely, that sustainable investment funds, which as I said, ended 2018 with $390 billion in assets under management reached their highest level ever by adding a net of $140 billion. Refer to Slide 4. This is up from $250 billion at year-end 2017, or a top-line increase of 56%. This is very good news for the sustainable funds segment but also a bit more nuanced.
The net increase is attributable to three factors: market movement, fund re-brandings and net cash flows. Refer to slide 5.
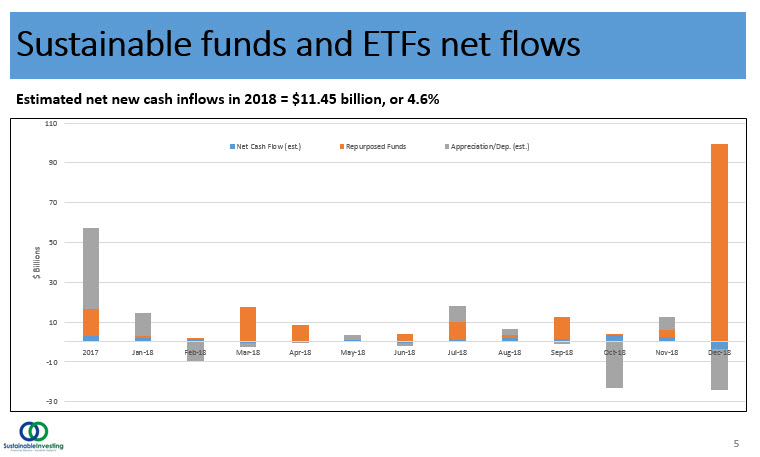
By far, the largest contributor to the increase is attributable to the rebranding or repurposing of existing funds. This contributed $155.9 billion.
Market movement had the second-largest impact. This factor depressed the value of assets by an estimated $27.4 billion.
The third component is cash flows, and positive cash inflows to sustainable funds during the year is estimated to have contributed $11.45 billion in assets. This represents a more modest 4.6% of the value of assets at December 31, 2017. But based on preliminary data, while the absolute number is quite small, it far outpaces the inflows into long-term US funds which were $157.0 billion, the lowest since 2008, or a paltry 0.8%.
Highlights of ESG related themes and events that unfolded during the course of 2018
Before I go into some additional details, I just want to highlight quickly some of the ESG related themes and events that unfolded during the course of 2018:
- When we came into 2018, there was continued fallout from extreme weather, natural disasters and sexual harassment revelations and reports that had been experienced the previous year.
- We were again confronted by gun violence and the use of semi-automatic style weapons because of the horrific Parkland, Florida mass shooting early in the year.
- Larry Fink of BlackRock issued another letter to CEO’s arguing that “society is demanding that companies, both public and private, serve a social purpose…” and related to this, a number of research articles and commentary focused on the theories of corporate profits and shared value and advocating for the adoption of long-term strategies.
- PIMCO expressed the view that a “quiet and profound pivot is underway in the sustainable investing space” with respect to fixed income.
- There were new revelations about Facebook’s data protection and privacy breaches.
- There were continuing actions on the part of the Trump administration’s Environmental Protection Agency (EPA) to roll back environmental regulations.
- The 2018 proxy season was notable for the high level of environmental and social proposals as well as a number of majority vote outcomes.
- The DOL struck a more cautious tone regarding ESG-themed investing within the context of fiduciary responsibility.
- The TCFD (Task Force on Climate Related Financial Disclosures) published its first status report while industry support for the reporting initiative continued to grow.
- Several authoritative scientific research reports were published on the status of global warming and climate change. The reports concluded that the world continues to emit historic levels of carbon dioxide and other greenhouse gas emissions, and the impacts of this is accelerating.
- COP 24, or the 24th Conference of the Parties to the United Nations Framework Convention on Climate Change was held in Poland and an agreement was reached by climate negotiators to bolster the 2015 Paris Climate Agreement.
- The Forum for Sustainable and Responsible Investment (USSIF) reported that through the beginning of 2018 assets linked to sustainable, responsible and impact investing (SRI) strategies have reached $12.0 trillion. Much of this growth was driven by asset managers, who now consider ESG factors in their investment decision making. While we are a bit skeptical of the top line numbers, the overall increase reported by USSIF is consistent with the growing attention to this area, even if perhaps as much as 50% of the assets sourced to sustainable strategies may be linked to exclusionary or negative screening practices, such as tobacco, weapons and alcohol, to mention just some.
With that as background, I’ll jump back to the asset growth which as I’ve said, is sourced to three factors: fund re-brandings, market movement, and net cash flows, in that order.
2018 Repurposed funds or re-branded funds
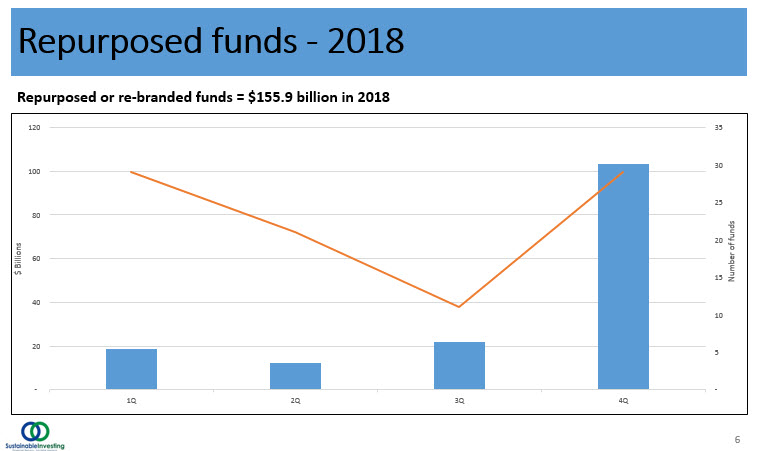
During the course of 2018 90 separate funds, from 25 separate fund companies, repurposed or rebranded existing funds by adopting a sustainable investing strategy and as I noted, the total assets shifted were $155.9 billion. Refer to slide 6.
The largest number occurred during the fourth quarter when two firms, JP Morgan with its adoption of ESG integration approaches and the American Funds American Mutual Fund implemented a negative screening policy that precludes the fund from investing in companies deriving the majority of their revenues from alcohol or tobacco products. The two firms alone shifted a total of 14 funds with combined assets of $87.9 billion in assets.
New ESG Funds in 2018
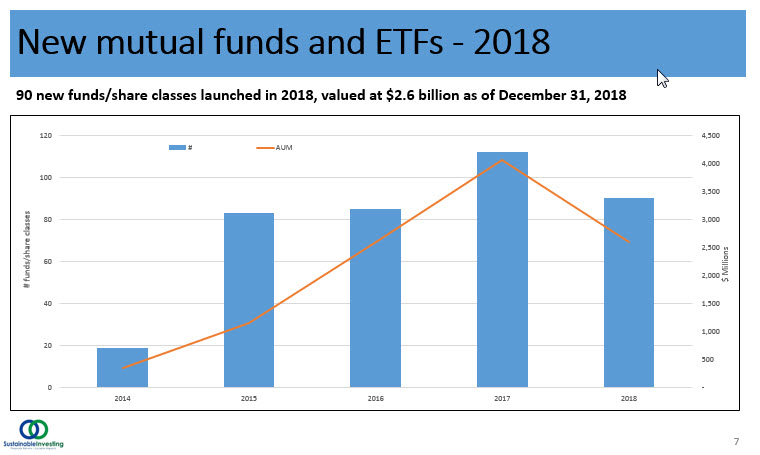
As I said earlier, positive cash flows were an estimated $11.5 billion and part of this is attributable to new funds. In 2018, new sustainable fund launches included some 90 funds, consisting of mutual funds and corresponding share classes as well as exchange-traded funds (ETFs) that were valued at $2,588.8 million as of December 31, 2018.
As you can see on slide 7, 2018 was not the best year for new sustainable fund formations. That designation belongs to 2017 when a total of 112 new mutual funds and their share classes, as well as ETFs, came to market with a value of $4,060.5 million of December 31, 2017.
Variety of sustainable investment funds and ETFs
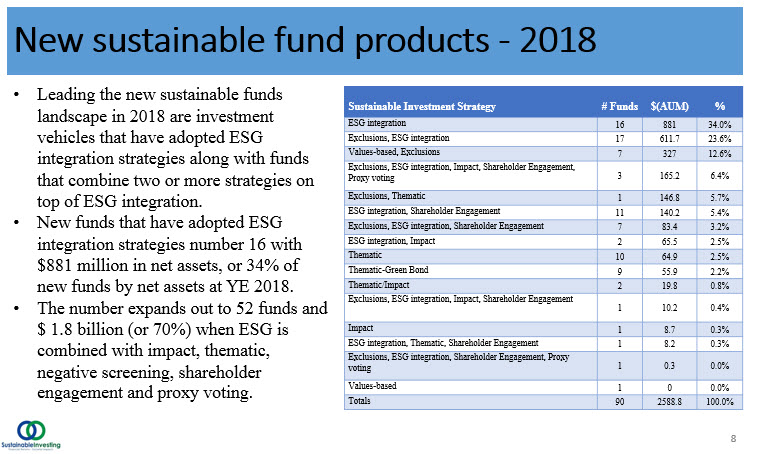
It’s also useful to dimension new funds by their sustainable investing strategies, and what we tried to do on slide 8 is classify new funds by their broad sustainable strategies, including more than one strategy where this was applicable.
- Leading the new sustainable funds landscape in 2018 are investment vehicles that have adopted ESG integration strategies along with funds that combine two or more strategies on top of ESG integration.
- New funds that have adopted ESG integration strategies number 16 with $881 million in net assets, or 34% of new funds by net assets at YE 2018.
- The number expands out to 52 funds and $1.8 billion (or 70%) when ESG is combined with impact, thematic, negative screening, shareholder engagement and proxy voting.
The adoption of at least the four broad-based strategies, and an even larger combination of two or more of these that are further multiplied when these strategies are actually implemented at the security and portfolio level, we believe, leads to a baffling number of options and contributes to confusion, we believe, particularly in the absence of clear explanations around how these strategies are implemented and transparency on their portfolio effects, performance results and impact outcomes. This means that investors have to spend more time understanding the approach each manager is taking and expected outcomes and this could be leading to sustainable investing paralysis.
Sustainable fund firms
I’d also like to point out that at the end of 2018, 127 firms were offering designated sustainable mutual funds and ETFs. This compares to 107 firms at the end of 2017, or an increase of 20 firms (19% gain). The largest 20 fund firms account for almost 89% of the assets in the sustainable segment and manage $343.2 billion in assets between them. That a slight decline from the 90.3% level of concentration at the end of 2017. Refer to slide 9. 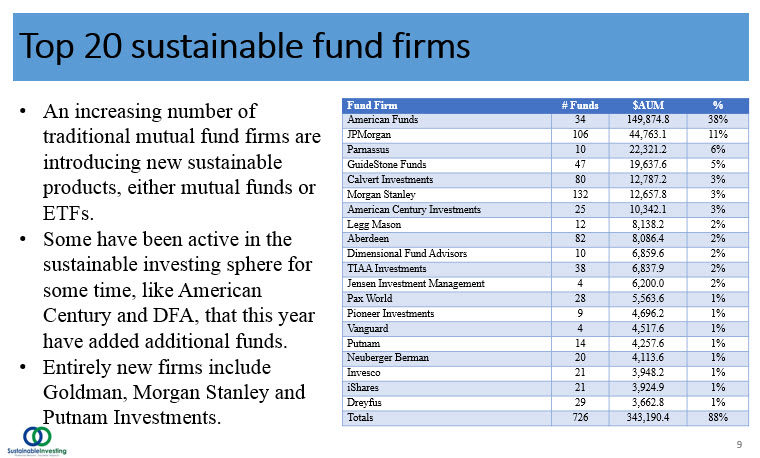
The profile of the largest firms has shifted in the last year as more of the traditional or mainstream firms established a presence in the sustainable sphere by repurposing existing funds. Firms like Legg Mason, Aberdeen, Jensen, Pioneer Investments, JP Morgan, Morgan Stanley and Dreyfus moved into the top 20 tier, while firms like Ariel, Amana, and Domini trended lower.
ESG Funds Performance Results in 2018
2018 turned out to be a very challenging and turbulent year. The S&P 500 Index posted its worst performance since 2008. On the other hand, investment-grade bonds, which were in negative territory all year long, gained 1.84% in December and this lifted the Bloomberg Barclays US Aggregate Index so that it ended up posting an increase of 0.01% for the full year.
Sustainable mutual funds and ETFs were not sparred. Across all funds, these investment vehicles posted returns for the year that averaged -7.7% with a median total return of -7.2%. Returns ranged from a high of 10.97% posted by a recently added ESG fund to a low of -29.57% registered by an ETF fund focused on China environmental stocks. This excluded the 226.41% posted by the small and volatile iPath Global Carbon ETN.
This is a pretty unsophisticated way of thinking about the performance results for this segment. Another approach is to review the performance of sustainable funds via two benchmarks that we created to track the performance of sustainable funds in a consistent way.
The first benchmark tracks sustainable large-cap equity funds. The index, which was initiated as of June 30, 2017 with data back to December 31, 2016, tracks the total return performance of the ten largest actively managed large-cap domestic equity mutual funds that employ a sustainable investing strategy beyond absolute reliance on exclusionary practices for religious, ethical or social reasons. To qualify for inclusion in the index, funds had to have in excess of $50 million in net assets and must the fund must proactively apply environmental, social and governance (ESG) criteria to the investment processes and decision making. In tandem with their ESG integration strategy, funds may also employ exclusionary strategies along with impact-oriented investment approaches as well as shareholder advocacy
The SUSTAIN Large Cap Equity Fund Index posted a decline of -5.30% during calendar year 2018 as compared to the S&P 500 that was down -4.38%, for a differential of 92 basis points.
Calculations of the SUSTAIN Index commenced as of December 31, 2016 and during its first year, the index also lagged the S&P 500. It registered a gain of 19.18% in 2017 versus 21.83% for the S&P 500 Index. The cumulative 2-year lag is now 3.69%. Refer to slide 10.
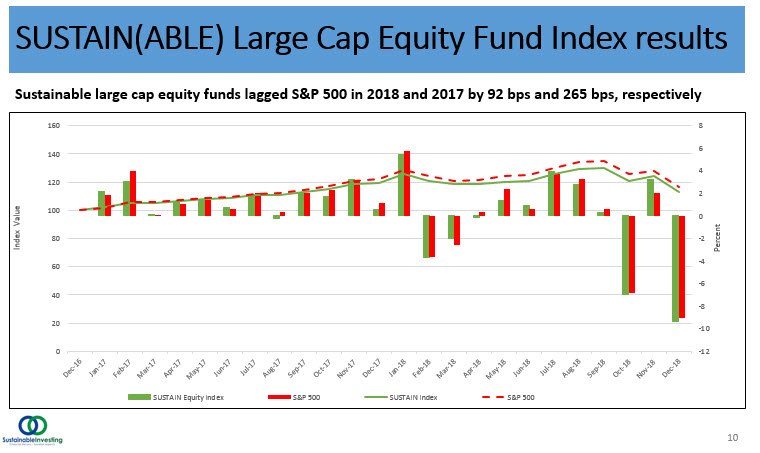
Calvert Equity A, one of ten funds that comprise the index, is the only fund often to exceed the performance of the S&P 500 Index over the 2-year period with a total return of 25.79%, a full 3.96% in excess of the 21.83% posted by the S&P 500.
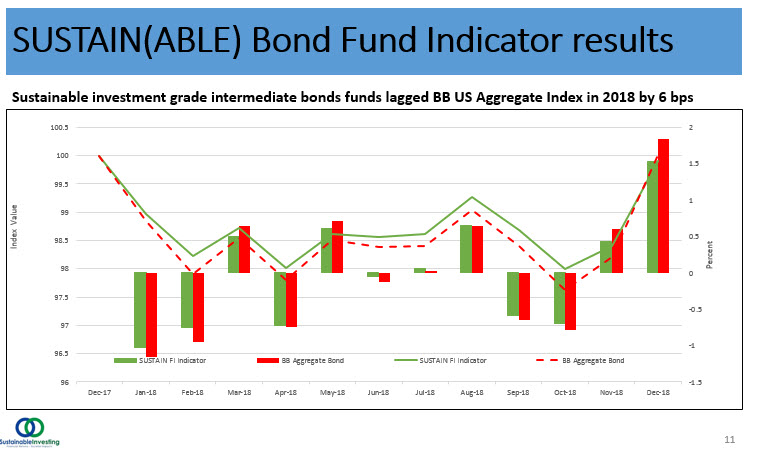
The second benchmark is fixed income-oriented that tracks the performance of only five funds. Initiated as of December 31, 2017, the indicator tracks the total return performance of the five largest actively managed investment-grade intermediate term bond mutual funds that are managed in a manner similar to the equity funds I just mentioned.
For 2018, the benchmark fell behind the equivalent conventional index, the Bloomberg Barclays US Aggregate Index that gained 0.01% versus a slight decline of -0.05% for the SUSTAIN Bond Fund Indicator, for a fractional 0.06% difference. Refer to slide 11.
ESG Outlook for 2019
- ESG integration will continue to gain traction in 2019 and is eventually expected to reach mainstream status: Positive results and risk mitigation.
- Most leading asset managers have introduced designated sustainable products. Even in the light of positive inflows, given the recent uncertainty and volatility in the markets, new fund formations within the leading asset management segment is likely to take a breather in 2019 whereas smaller and medium-sized firms are more likely to launch new products or repurpose existing ones.
- While client demand is strong based on survey data, especially among millennials and women investors, existing funds have a strong institutional component and new funds are weighted in favor of institutional investors of various types. That said, retail flows will be constrained. And the reason for this, in our view, is the
- Baffling number of sustainable investing options and approaches leads to confusion and, to stimulate retail-oriented cash flows, asset managers and financial intermediaries will have to increase emphasis on sustainable investing education, reporting and disclosure.
- There will be continuing improvement in the quality and coverage of lESG scores and ratings; expansion in the number, type and quality of ESG indexes.
Sustainable Investment Managers Due Diligence
I. When Conducting Due Diligence of Sustainable Funds – Realize That There Are:
A. Distinctive ESG investment selection criteria & portfolio allocation overlay(s) – these may be quantitative, qualitative and/or intangible
B. Additional portfolio restrictions & limitations, some of which address non-financial sustainability considerations
C. Specialized analytical tools, data, skill-sets & dedicated staff needs
II. Different Questions for Different Sustainable Investment Approaches
A. Exclusionary or “Negative Screening” Approach
a) What industries, sectors, companies & securities are currently excluded from the portfolio?
b) What criteria are used to define excluded companies within sectors and industries – how are selection criteria weighted?
c) What methods are employed to control tracking error?
B. Thematic & Impact Approach:
a) What ESG issues or themes are currently being targeted for action by the pm?
b) How does the pm identify, select, & prioritize companies & impact themes for action – how are impact objectives & outcomes established?
c) What is the portfolio manager’s process for measuring, tracking & assessing a company’s performance toward attaining an impact or thematic objective?
C. ESG Integration Approach:
a) How are sustainability factors incorporated into the portfolio management process including: their weights as compared to other security selections & portfolio construction goals i.e., financial growth, exposure, & investment style?
b) What data & methodologies are used when evaluating sustainable selections – is a 3rd party or in-house ESG scoring source used?
c) What have been the effects of ESG-integration on fund risk, performance, & other portfolio characteristics?
D. Engagement & Proxy Voting Approach:
a) How does the pm identify specific portfolio holdings & companies for engagement?
b) What determines the level & nature of pm involvement with companies?
c) When does the pm initiate an engagement action – are there limits on the number of such actions at a given time?
III. Manager & Parent Company’s “Cultural” Commitment to Sustainable Practices
*NOTE: SRA will publish a paper dedicated to the due diligence of sustainable fund managers, which will include detailed questions for each approach. Our next webinar will focus exclusively on this topic. The paper and webinar is scheduled for late in the 1Q19.
Sustainable Investing Trends in 2019 and 2018 ESG Performance
Summary: Remarks presented at the January 25, 2019 webinar entitled on sustainable investing that covered: (1) 2018 sustainable fund developments, (2) 2019 outlook and (3) conducting sustainable investment managers due diligence.
Share This Article:
Summary: Remarks presented at the January 25, 2019 webinar entitled on sustainable investing that covered: (1) 2018 sustainable fund developments, (2) 2019 outlook and (3) conducting sustainable investment managers due diligence.
Note: Presentation slides were made available ahead of the webinar. Relevant slides have been inserted into this document.
Remarks: Good morning and welcome to our sustainable investing webinar at which Steve and I plan to review 2018 sustainable fund developments and our 2019 outlook. In addition, we will discuss the topic of conducting sustainable investment managers due diligence. At the conclusion of our remarks, we will have a Q&A session.
I want to thank you all for joining us yet again after our technical difficulties and I want to offer a special shout out to all my Linked In contacts for being supportive and your kind notes.
Steve and I are with Sustainable Research and Analysis (SRA), an independent firm specializing in sustainable investment funds, their management and distribution. SRA’s goal is to provide financial intermediaries and fund professionals with critical insights and research to support their client’s sustainable investment needs.
So, to begin, I want to make clear that when we refer to sustainable investing, we use it as an umbrella term to capture at least 4 broad sustainable investing strategies. Sustainable investing is the process of allocating capital to companies and other entities with the prospects of achieving a financial return while at the same time attaining a positive societal impact. While the definition has been changing over time, this concept today encapsulates a range of four overarching investment approaches or strategies, although the financial return profiles associated with each of these can vary. Most practitioners agree that these encompass the following approaches:
These approaches or strategies are described in more details in investment research.
Also, I should note that we are evaluating this segment of the market through the prism of mutual funds and ETFs. In total, there are 89 ETFs and 1,191 mutual funds and share classes with a combined total of $390.4 billion in assets as of year-end 2018. This is a segment of designated mutual funds and ETFs, that, either due to their explicit theme or prospectus language that qualifies these funds based on their sustainable investing mandate.
Mutual Funds and ETFs/ETNs end year 2018 with $390.4 billion in AUM; an estimated $11.45 billion, or 4.6%, is due to net positive inflows while $155.9 billion is due to re-brandings
As many of you may already know, this past year has been a challenging one for the asset management industry, in particular, I am referring to flows and year-end assets under management. Generally, investors continued to pull money out of active funds and placed assets into passive funds. But even more broadly speaking, stand-alone asset management firms or asset management units of banks or other financial institutions, have been reporting declines in revenues and assets under management. BlackRock, for example, reported that assets declined by some $300 billion or 5% year-over-year. Also reporting declines in assets under management were Goldman, Morgan Stanley, JP Morgan Chase, and Charles Schwab.
This stands in contrast to what we found in our research for sustainable funds in 2018. Namely, that sustainable investment funds, which as I said, ended 2018 with $390 billion in assets under management reached their highest level ever by adding a net of $140 billion. Refer to Slide 4. This is up from $250 billion at year-end 2017, or a top-line increase of 56%. This is very good news for the sustainable funds segment but also a bit more nuanced.
The net increase is attributable to three factors: market movement, fund re-brandings and net cash flows. Refer to slide 5.
By far, the largest contributor to the increase is attributable to the rebranding or repurposing of existing funds. This contributed $155.9 billion.
Market movement had the second-largest impact. This factor depressed the value of assets by an estimated $27.4 billion.
The third component is cash flows, and positive cash inflows to sustainable funds during the year is estimated to have contributed $11.45 billion in assets. This represents a more modest 4.6% of the value of assets at December 31, 2017. But based on preliminary data, while the absolute number is quite small, it far outpaces the inflows into long-term US funds which were $157.0 billion, the lowest since 2008, or a paltry 0.8%.
Highlights of ESG related themes and events that unfolded during the course of 2018
Before I go into some additional details, I just want to highlight quickly some of the ESG related themes and events that unfolded during the course of 2018:
With that as background, I’ll jump back to the asset growth which as I’ve said, is sourced to three factors: fund re-brandings, market movement, and net cash flows, in that order.
2018 Repurposed funds or re-branded funds
During the course of 2018 90 separate funds, from 25 separate fund companies, repurposed or rebranded existing funds by adopting a sustainable investing strategy and as I noted, the total assets shifted were $155.9 billion. Refer to slide 6.
The largest number occurred during the fourth quarter when two firms, JP Morgan with its adoption of ESG integration approaches and the American Funds American Mutual Fund implemented a negative screening policy that precludes the fund from investing in companies deriving the majority of their revenues from alcohol or tobacco products. The two firms alone shifted a total of 14 funds with combined assets of $87.9 billion in assets.
New ESG Funds in 2018
As I said earlier, positive cash flows were an estimated $11.5 billion and part of this is attributable to new funds. In 2018, new sustainable fund launches included some 90 funds, consisting of mutual funds and corresponding share classes as well as exchange-traded funds (ETFs) that were valued at $2,588.8 million as of December 31, 2018.
As you can see on slide 7, 2018 was not the best year for new sustainable fund formations. That designation belongs to 2017 when a total of 112 new mutual funds and their share classes, as well as ETFs, came to market with a value of $4,060.5 million of December 31, 2017.
Variety of sustainable investment funds and ETFs
It’s also useful to dimension new funds by their sustainable investing strategies, and what we tried to do on slide 8 is classify new funds by their broad sustainable strategies, including more than one strategy where this was applicable.
The adoption of at least the four broad-based strategies, and an even larger combination of two or more of these that are further multiplied when these strategies are actually implemented at the security and portfolio level, we believe, leads to a baffling number of options and contributes to confusion, we believe, particularly in the absence of clear explanations around how these strategies are implemented and transparency on their portfolio effects, performance results and impact outcomes. This means that investors have to spend more time understanding the approach each manager is taking and expected outcomes and this could be leading to sustainable investing paralysis.
Sustainable fund firms
I’d also like to point out that at the end of 2018, 127 firms were offering designated sustainable mutual funds and ETFs. This compares to 107 firms at the end of 2017, or an increase of 20 firms (19% gain). The largest 20 fund firms account for almost 89% of the assets in the sustainable segment and manage $343.2 billion in assets between them. That a slight decline from the 90.3% level of concentration at the end of 2017. Refer to slide 9.
The profile of the largest firms has shifted in the last year as more of the traditional or mainstream firms established a presence in the sustainable sphere by repurposing existing funds. Firms like Legg Mason, Aberdeen, Jensen, Pioneer Investments, JP Morgan, Morgan Stanley and Dreyfus moved into the top 20 tier, while firms like Ariel, Amana, and Domini trended lower.
ESG Funds Performance Results in 2018
2018 turned out to be a very challenging and turbulent year. The S&P 500 Index posted its worst performance since 2008. On the other hand, investment-grade bonds, which were in negative territory all year long, gained 1.84% in December and this lifted the Bloomberg Barclays US Aggregate Index so that it ended up posting an increase of 0.01% for the full year.
Sustainable mutual funds and ETFs were not sparred. Across all funds, these investment vehicles posted returns for the year that averaged -7.7% with a median total return of -7.2%. Returns ranged from a high of 10.97% posted by a recently added ESG fund to a low of -29.57% registered by an ETF fund focused on China environmental stocks. This excluded the 226.41% posted by the small and volatile iPath Global Carbon ETN.
This is a pretty unsophisticated way of thinking about the performance results for this segment. Another approach is to review the performance of sustainable funds via two benchmarks that we created to track the performance of sustainable funds in a consistent way.
The first benchmark tracks sustainable large-cap equity funds. The index, which was initiated as of June 30, 2017 with data back to December 31, 2016, tracks the total return performance of the ten largest actively managed large-cap domestic equity mutual funds that employ a sustainable investing strategy beyond absolute reliance on exclusionary practices for religious, ethical or social reasons. To qualify for inclusion in the index, funds had to have in excess of $50 million in net assets and must the fund must proactively apply environmental, social and governance (ESG) criteria to the investment processes and decision making. In tandem with their ESG integration strategy, funds may also employ exclusionary strategies along with impact-oriented investment approaches as well as shareholder advocacy
The SUSTAIN Large Cap Equity Fund Index posted a decline of -5.30% during calendar year 2018 as compared to the S&P 500 that was down -4.38%, for a differential of 92 basis points.
Calculations of the SUSTAIN Index commenced as of December 31, 2016 and during its first year, the index also lagged the S&P 500. It registered a gain of 19.18% in 2017 versus 21.83% for the S&P 500 Index. The cumulative 2-year lag is now 3.69%. Refer to slide 10.
Calvert Equity A, one of ten funds that comprise the index, is the only fund often to exceed the performance of the S&P 500 Index over the 2-year period with a total return of 25.79%, a full 3.96% in excess of the 21.83% posted by the S&P 500.
The second benchmark is fixed income-oriented that tracks the performance of only five funds. Initiated as of December 31, 2017, the indicator tracks the total return performance of the five largest actively managed investment-grade intermediate term bond mutual funds that are managed in a manner similar to the equity funds I just mentioned.
For 2018, the benchmark fell behind the equivalent conventional index, the Bloomberg Barclays US Aggregate Index that gained 0.01% versus a slight decline of -0.05% for the SUSTAIN Bond Fund Indicator, for a fractional 0.06% difference. Refer to slide 11.
ESG Outlook for 2019
Sustainable Investment Managers Due Diligence
I. When Conducting Due Diligence of Sustainable Funds – Realize That There Are:
A. Distinctive ESG investment selection criteria & portfolio allocation overlay(s) – these may be quantitative, qualitative and/or intangible
B. Additional portfolio restrictions & limitations, some of which address non-financial sustainability considerations
C. Specialized analytical tools, data, skill-sets & dedicated staff needs
II. Different Questions for Different Sustainable Investment Approaches
A. Exclusionary or “Negative Screening” Approach
a) What industries, sectors, companies & securities are currently excluded from the portfolio?
b) What criteria are used to define excluded companies within sectors and industries – how are selection criteria weighted?
c) What methods are employed to control tracking error?
B. Thematic & Impact Approach:
a) What ESG issues or themes are currently being targeted for action by the pm?
b) How does the pm identify, select, & prioritize companies & impact themes for action – how are impact objectives & outcomes established?
c) What is the portfolio manager’s process for measuring, tracking & assessing a company’s performance toward attaining an impact or thematic objective?
C. ESG Integration Approach:
a) How are sustainability factors incorporated into the portfolio management process including: their weights as compared to other security selections & portfolio construction goals i.e., financial growth, exposure, & investment style?
b) What data & methodologies are used when evaluating sustainable selections – is a 3rd party or in-house ESG scoring source used?
c) What have been the effects of ESG-integration on fund risk, performance, & other portfolio characteristics?
D. Engagement & Proxy Voting Approach:
a) How does the pm identify specific portfolio holdings & companies for engagement?
b) What determines the level & nature of pm involvement with companies?
c) When does the pm initiate an engagement action – are there limits on the number of such actions at a given time?
III. Manager & Parent Company’s “Cultural” Commitment to Sustainable Practices
*NOTE: SRA will publish a paper dedicated to the due diligence of sustainable fund managers, which will include detailed questions for each approach. Our next webinar will focus exclusively on this topic. The paper and webinar is scheduled for late in the 1Q19.
Sustainableinvest.com
Benefits
Free access to regularly updated original research and analysis focused exclusively on sustainable finance and investing, providing investors with the guidance needed to make informed investment decisions that align with their personal values and financial goals while also contributing to the advancement of positive long-term environmental and social outcomes.
By offering financial support for our current work, either in the form of a one-time or regular contributions, you help to defray some of the costs associated with conducting our research and analysis as well as to maintain the www.sustainablest.wpengine.com website.
Helping us to expand our research capabilities and offerings over time to cover additional relevant topics geared to sustainable investors.
Sign up to free newsletters.
By submitting this form, you are consenting to receive marketing emails from: . You can revoke your consent to receive emails at any time by using the SafeUnsubscribe® link, found at the bottom of every email. Emails are serviced by Constant Contact